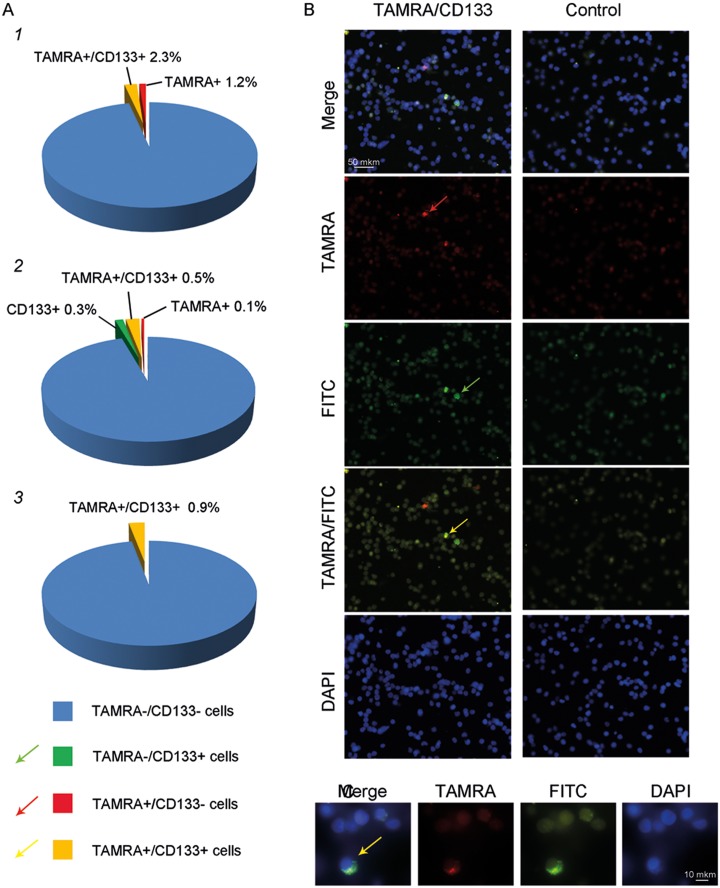
Figure 2.
Analysis of TAMRA and CD133 double staining in glioma cells. A, Pie chart showing the percentage of CD133+, TAMRA+, and CD133+/TAMRA+ cells in 3 patient samples (patients #51, #47, and 48),10,22,23 as assayed by microscopy analysis of 7000 and 500 cells, respectively. B, Cytology images showing TAMRA+ signal (red arrow), CD133+ signal (green arrow), and colocalization of both TAMRA+ and CD133+ signals in the cells (yellow arrow, merged image). C, Zoom in of a TAMRA+/CD133+ double-positive cell.

