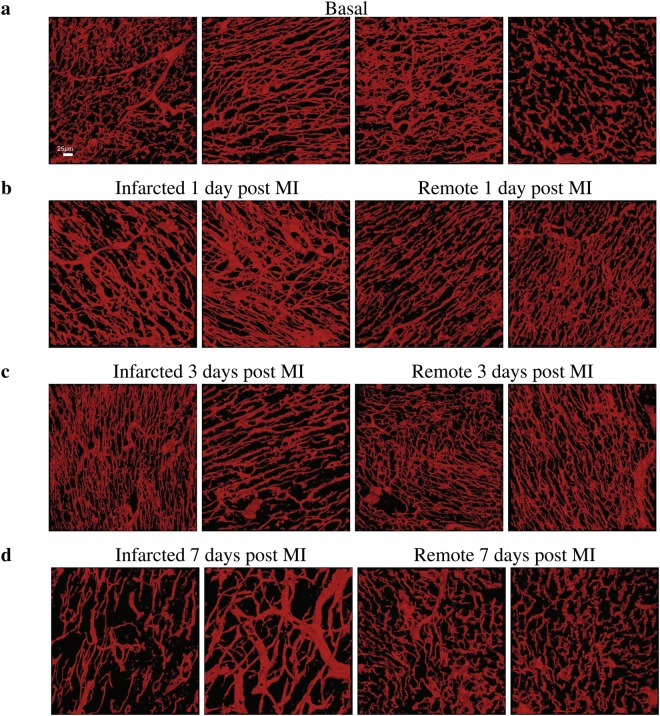
Figure 2.
Representative 3D reconstructions of the cardiac microvasculature from tissues at different pathophysiological conditions. (a) Microvasculature reconstructed from tissues at basal conditions. (b) Microvasculature reconstructed from tissues at 1 day post MI. (c) Microvasculature reconstructed from tissues at 3 days post MI. (d) Microvasculature reconstructed from tissues at 7 days post MI. In panels (b–d) the first two volumes correspond to tissues from infarcted areas at the corresponding time-point after MI, while the third and fourth volumes to tissues from remote ones. Scale bar (25 μm) is the same for all images.

