Figure 4.
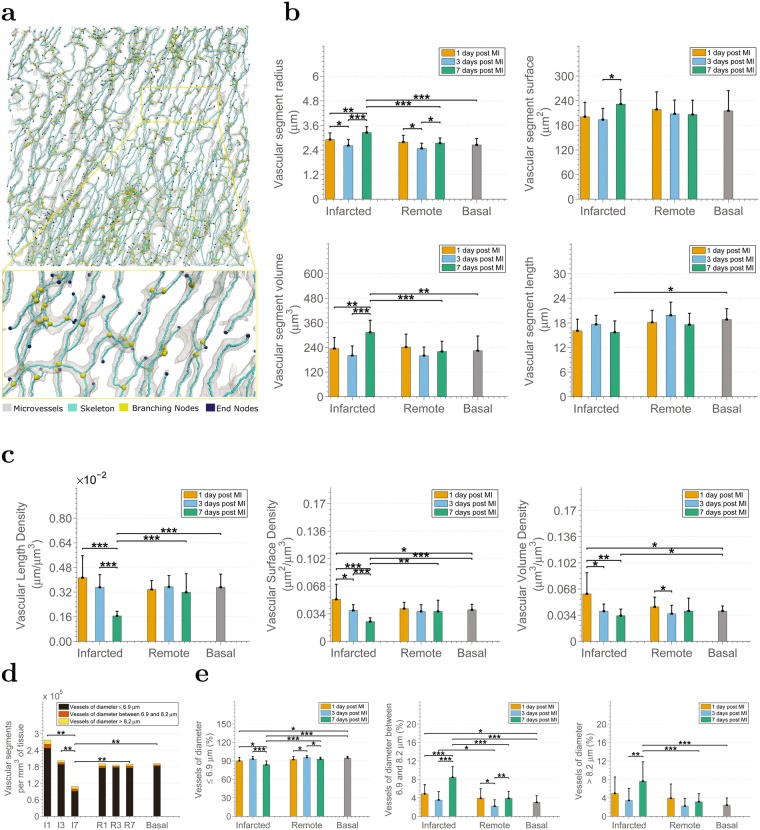
Microvascular angioadaptation occurs in response to MI. (a) Example graph-based representation of a microvascular structure. Each microvessel, i.e. segment from branching node to branching/ending node, is considered as a tube of constant radius. (b) Analysis of the characteristics of the microvessels in the pig infarcted heart in terms of vascular segment radius, vascular segment length, vascular segment surface, and vascular segment volume. (c) Analysis of vascular length density, vascular surface density, and vascular volume density. In panels (d) and (e), changes in the number and percentages of microvessels in the infarcted pig heart according to their radius and to the physiological condition of the tissue. In particular, (d) analysis of the number of microvascular segments per mm3 of tissue. (e) Analysis of the percentage of vascular segments with radius smaller than 6.9 μm, with radius between 6.9 and 8.2 μm and with radius larger than 8.2 μm. I1, I3, I7, R1, R3, R7 stand for infarcted areas and remote areas at 1, 3, 7 days post MI respectively. Note that statistical hypothesis testing in (d) refers to the comparison of the overall number of vascular segments i.e. the sum of the three categories.

