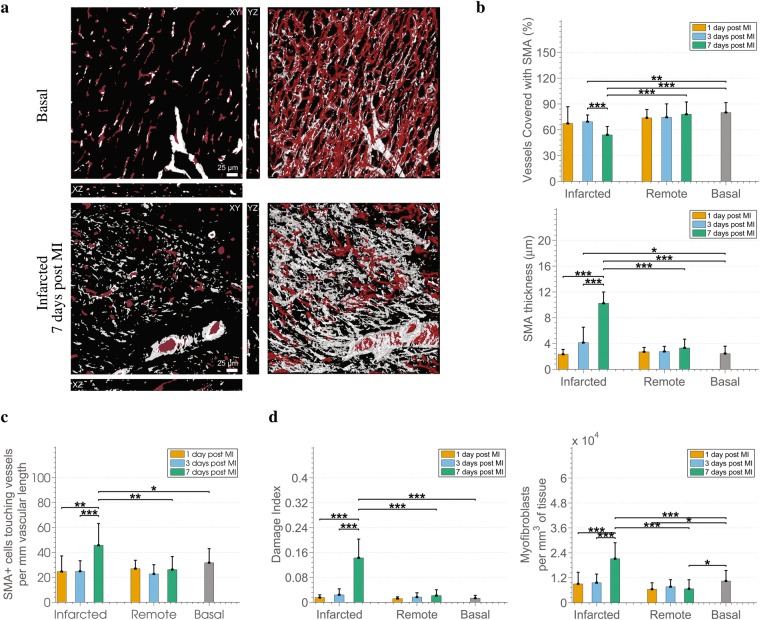
Figure 5.
Changes in SMA+ perivascular cells and myofibroblasts in the aftermath of MI. (a) Example of 3D reconstructions of the microvasculature (red) merged with the segmentation of the SMA+ cells channel (grey) in a basal and an infarcted 7 days post MI case. (b) Changes in SMA+ related metrics, i.e. the percentage of vessels with a SMA+ coat along with the corresponding thickness of the coat. (c) Analysis of the number of SMA+ cells of which the SMA+ coat covering the microvessels consists. (d) Analysis of the cardiac tissue by means of indicators of tissue fibrosis, i.e. the Damage Index (percentage of SMA+ volume that are not associated with vessels), and number of myofibroblasts per mm3 of tissue.

