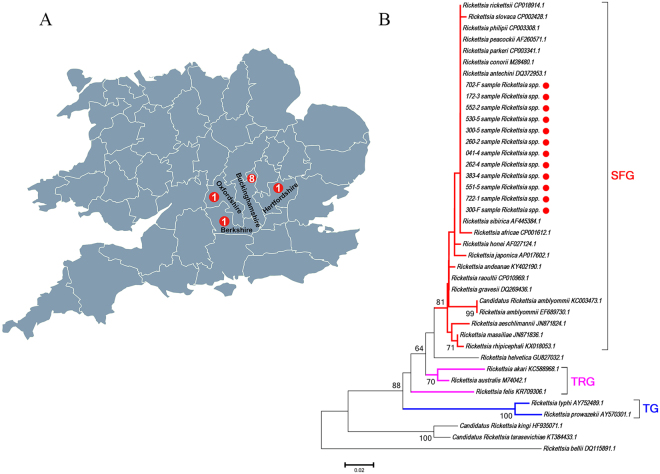
Figure 4.
Detection and analysis of Rickettsia spp. from UK bat ticks. (A) Map showing the sampling sites of Rickettsia spp. positive bat ticks. The red dots indicate the sites of Rickettsia spp positive A. vespertilionis. This figure is not included in the Creative Commons licence for the article; all rights reserved. Taken from Beijing Zcool Internet Technology Co., Ltd. (B) Neighbor Joining phylogenetic analysis based on a partial sequence of the 17 K Da protein gene of Rickettsia spp. Bootstrap values are indicated at the nodes. Scale bar indicates the degree of divergence represented by a given length of branch. The red dot indicates the sequence of Rickettsia spp. acquired in this study. Numbers in red dots indicate the number of bats with Rickettsia spp. positive ticks, sampled from each county.

