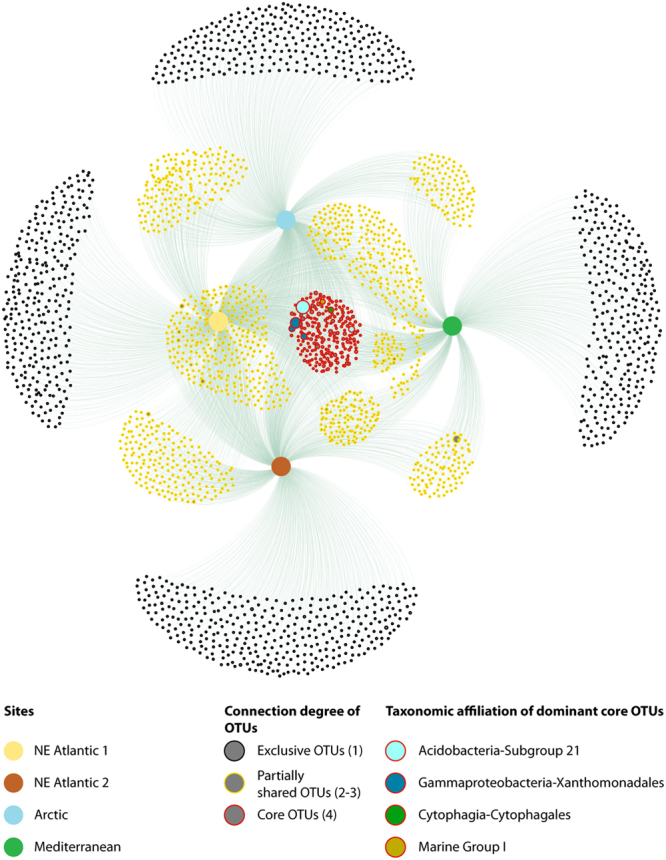
Figure 3.

OTU network of the extracellular DNA pools from the sediments of the different continental margins. Dot size within the network is proportional to the abundance of sequences for each OTU. Dots circled in red represent extracellular core OTUs, dot circled in yellow are partially shared (among two or more pools) OTUs, dots circled in black are OTUs exclusive of each pool. The core OTUs contributing at least for 20 sequences are shown. The numbers in parentheses represent the number of connections among OTUs and samples: 1 for exclusive OTUs, 2–3 for partially shared OTUs and 4 for core OTUs.
