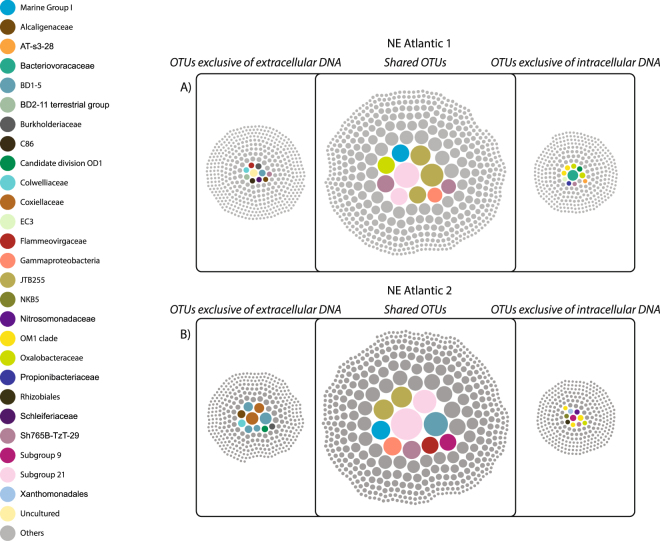
Figure 4.
OTUs shared between extracellular and intracellular DNA pools and exclusive OTUs of each pool from the sediments of NE Atlantic 1 (A) and NE Atlantic 2 (B) sites. Dot size is proportional to the contribution of sequences to each OTU belonging to the different prokaryotic families. The OTUs, which contribute most to the prokaryotic assemblage in terms of sequences, are colored according to their taxonomic affiliation (at the lowest identifiable taxonomic level).

