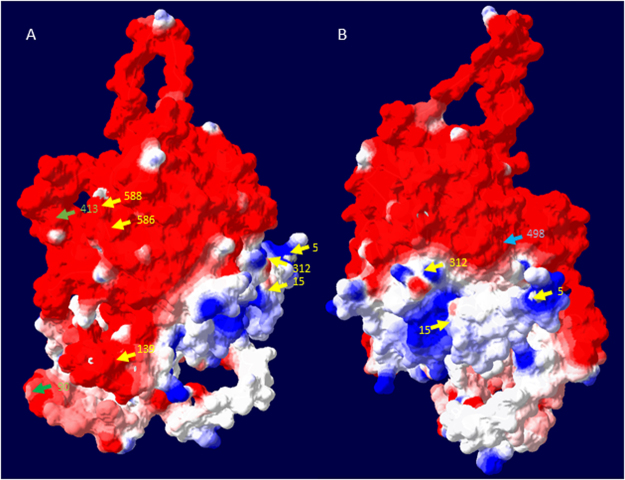
Figure 4.
Structural models of PhaC depicting lysine residues proposed as sites conjugated to the activated polysaccharide. The structural model of PhaC was deduced from the crystal structure of the C-terminal region of the PHB synthase from Ralstonia eutropha (5HZ2) using i-Tasser server (https://zhanglab.ccmb.med.umich.edu/I-TASSER/). Resulting atom coordinates were displayed using the Swiss-PDB-Viewer (Version. 4.10) while computing the model surface using colouring based on the electrostatic potential. Arrows show the location of lysine residues and their sequence position, which were identified as possible sites for conjugation of the activated polysaccharide. Yellow and blue arrows show sites identified when PhaC was displayed on PHB beads, while blue arrows indicate sites which remained accessible for conjugation after PhaC was fused to NadA and displayed on PHB beads. The green arrows indicate conjugation sites accessible in PhaC only upon fusion to NadA. (A) Horizontal 90° clockwise rotation of the structural model shown in (B).

