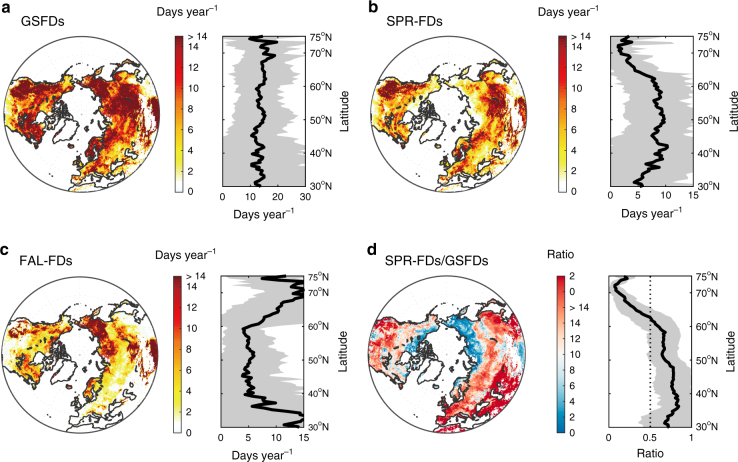
Fig. 1.
Spatial distribution of average frost days during growing season for 1982–2012. The number of frost days in the Northern Hemisphere was averaged from the results of the Princeton and WFDEI data sets. a–c indicates frost days and their variation along the gradient of latitude (black line and gray area presents the average frost days and its standard deviation across latitudes, respectively) calculated during growing season (GSFDs, from SOS to EOS), spring (SPR-FDs, from SOS to summer solstice) and autumn (FAL-FDs, from summer solstice to EOS). d displays the ratio of the number of frost days between (b) and (a). Maps were created using Matlab R2014b

