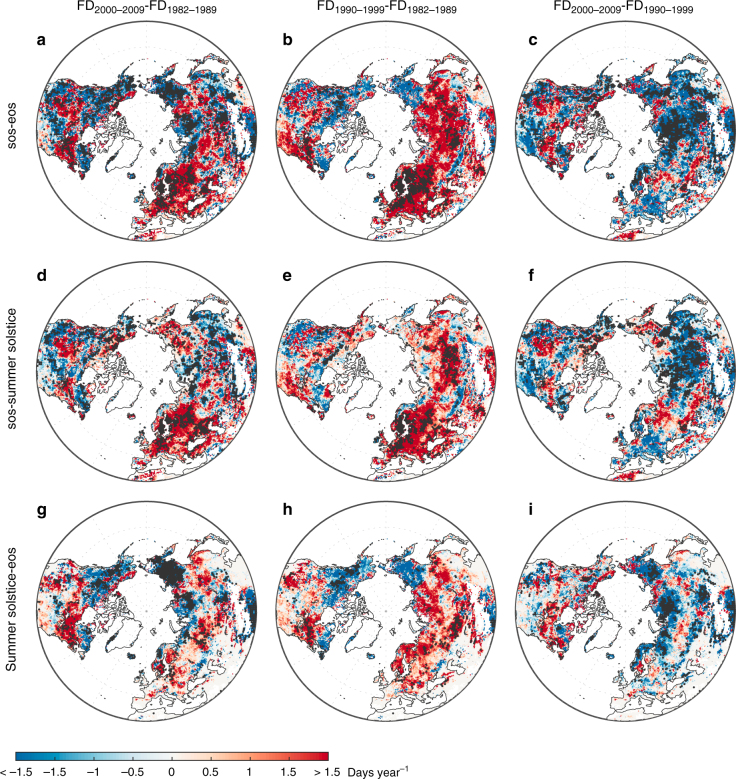
Fig. 2.
Decadal changes in average frost days during growing season. The number of frost days (FD) in the Northern Hemisphere was averaged from the results of the Princeton and WFDEI data sets. The left, center, and right panels indicate the differences in the average number of frost days between the 1980s and the 2000s, the 1980s and the 1990s, and the 1990s and the 2000s. The upper, middle, and bottom panels show the time periods used to calculate the number of frost days (a–c GSFDs, from SOS to EOS, d–f SPR-FDs, from SOS to the summer solstice, and g–i FAL-FDs, from the summer solstice to EOS). Dotted areas indicate regions with significant changes (P < 0.05, t-test) in the number of frost days. Maps were created using Matlab R2014b

