Figure 1.
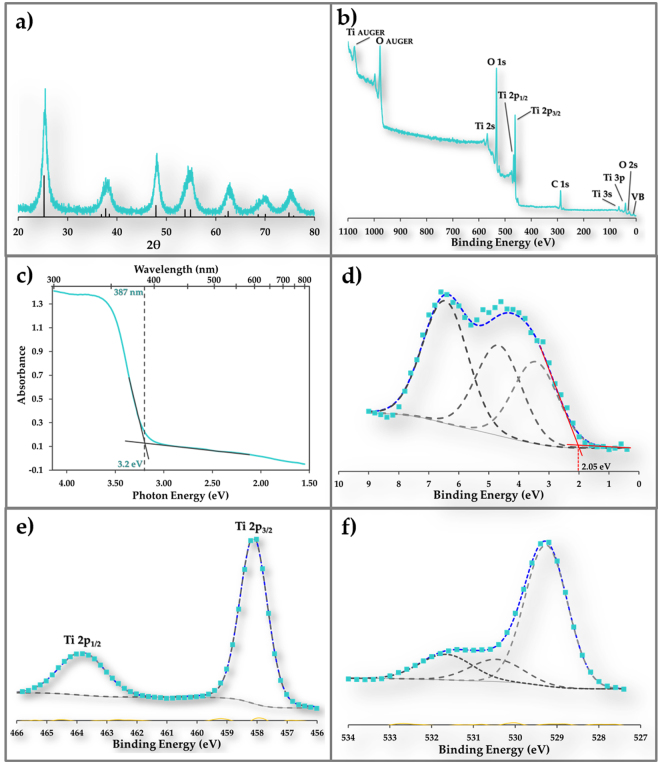
Physical characterization of pristine anatase. (a) XRD spectrum of anatase used in this study. The black lines are data for standard anatase. (b) XPS spectrum for anatase used in this study. Adventitious carbon was used as reference. (c) Ground state absorption spectrum of anatase showing bandgap (3.2 eV) estimation. (d) XPS high resolution valence band spectrum for anatase showing the edge of valence band at 2.05 eV. (e) XPS high resolution Ti 2p spectrum for anatase showing the Ti 2p3/2 peak at 458.1 eV and Ti 2p1/2 peak at 463.8 eV. (f) XPS high resolution O 1 s spectrum for anatase. Peaks at 529.3 eV, 530.5 eV and 531.7 eV are attributed to oxygen in the TiO2 lattice, surface Ti-OH and physisorbed water, respectively.

