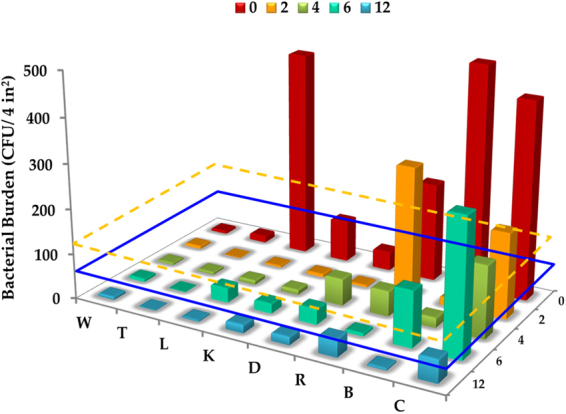
Figure 7.

Beta facility testing. Reduction in bacterial burden on surfaces with antimicrobial coating. For a given surface, the bars represent counts (n = 3) at times from 0 to 12 months. W = Wall; T = Thermostat; L = Locker; K = Knob; D = Soap Dispenser; R = Bathroom Rail; B = Bed Rail; C = Counter. The blue dashed line indicates the threshold of microbial counts for benign surfaces, and the yellow dashed line indicates the average microbial counts on copper surfaces in a clinical trial2.
