Fig. 3.
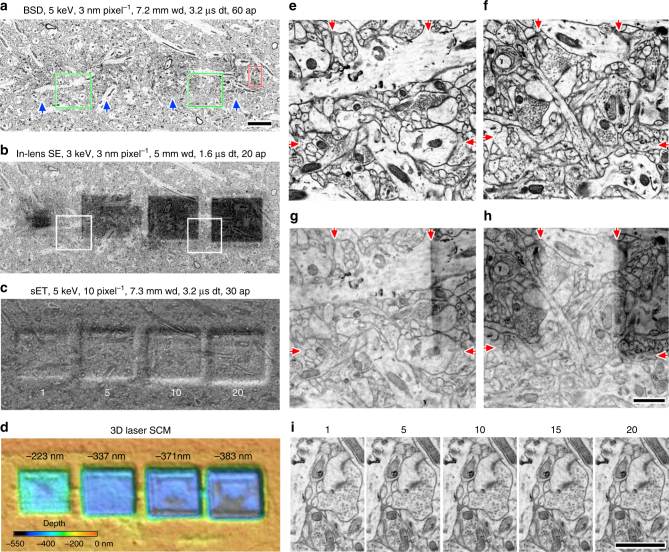
Repeated image capturing does not substantially affect image quality. a Image of the mHMS ultrathin section of cortex captured with BSD for 3.2 µs dwell time, 3 nm pixel−1, 60 μm aperture at 5 keV, 2.8 ke− nm−2 electron dose, where the 2048×2048 image size, 3.2 µs dwell time, 3 nm pixel−1, 60 μm aperture at 5 keV had been captured one, 5, 10 and 20 times indicated by blue arrows from left to right. Scale, 3 µm, is also for b–d. b Image of the same location of a captured with an In-lens SE detector for 1.6 µs dwell time, 3 nm pixel−1, 20 μm aperture at 3 keV. Darker squares correspond with the pre-imaged area. c The same area imaged with the ETD. The imaging times are indicated below the depression square. d The surface profile image. Depression depth is indicated above the depression square. e. Enlarged image of left green square in a. Arrows on the top left and middle left indicate the border of the once imaged area. Arrows on the top right and middle right indicate the border of the area imaged 5 times. f Enlarged image of right green square in a. Arrows on the top left and middle left indicate the border of the area imaged 10 times. Arrows on the top right and middle right indicate the border of the area imaged 20 times. g Enlarged image of left square in b. Arrows indicate the border shown in e. h Enlarged image of right square in b. Arrows indicate the border shown in f. Scale, 1 µm, is also for e–g. i Enlarged image of red rectangle in a. The number of imaging times are shown above the images. Scale, 1 µm. wd, working distance; dt, dwell time; ap, aperture

