Fig. 6.
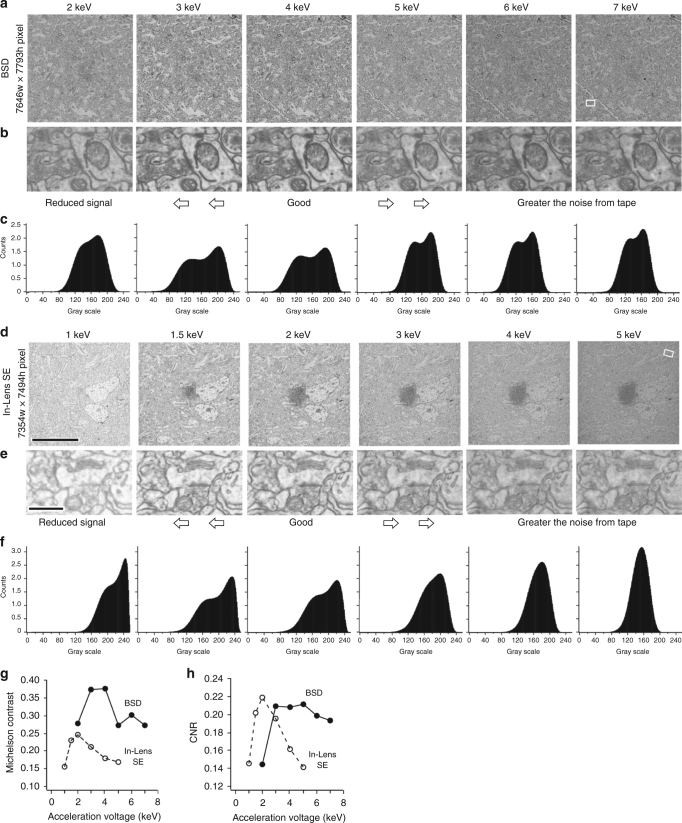
Image quality varies with different acceleration voltages. a Images of TOLA plus lead section stained brain tissue on the CNT tape are captured with a BSD for 3 nm pixel−1, 7646 × 7793 pixel image size, 3.2 µs dwell time, 60 µm aperture, with different acceleration voltage strengths (2–7 keV) with optimized working distance (7.6 mm: 6 keV, 7.7 mm: 5 keV and 4 keV, 7.8 mm: 3 keV, 7.9 mm: 2 keV). b Enlarged images of each acceleration voltage showing a synapse located in the rectangle in right panel of a. c Intensity histogram of the image in a. d Images of the same brain tissue section are captured with an In-lens SE detector for 3 nm pixel−1, 7354 × 7494 pixels image, 20 µm aperture, with different acceleration voltage strengths (1–5 keV) with optimized working distance (4.0 mm: 4–6 keV, 4.1 mm: 1–3 keV) on the CNT tape. Scale, 10 µm, is also for a. e Enlarged images of each acceleration voltage showing a synapse located in the rectangle in right panel of d. Scale, 0.5 µm, is also for b. f Intensity histogram of the image in d. g Michelson contrast values at half width of the intensity histogram. h Contrast-to-noise ratio (CNR) extracted from the intensity histogram

