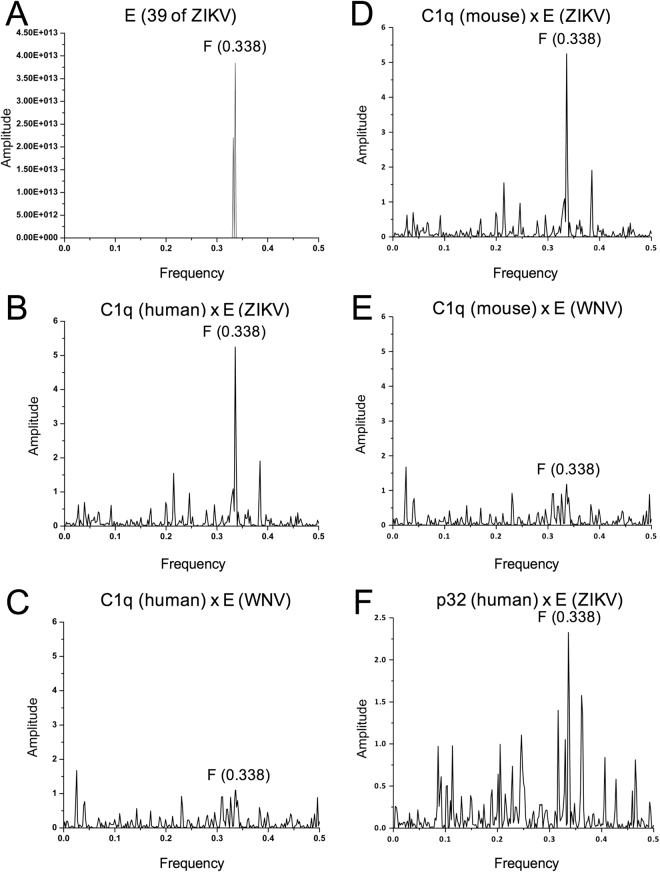
Figure 1.
The ISM analysis of ZIKV E protein and C1q protein. (A) The consensus informational spectrum of 39 ZIKV E proteins (Supplementary dataset 1). (B) The cross-spectrum of E protein from ZIKV [strain H/PF/2013 (KJ776791)] and human C1q protein (NP_758957). (C) The cross-spectrum of WNV E protein (ACV44196) and the human C1q protein. (D) The cross-spectrum of E protein from ZIKV and murine C1q protein (NP_031600). (E) The cross-spectrum of WNV E protein and the murine C1q protein. (F) The cross-spectrum of E protein from ZIKV and human p32 protein (Q07021). The abscissa represents ISM frequencies, the ordinates are normalized amplitudes corresponding to each frequency component.

