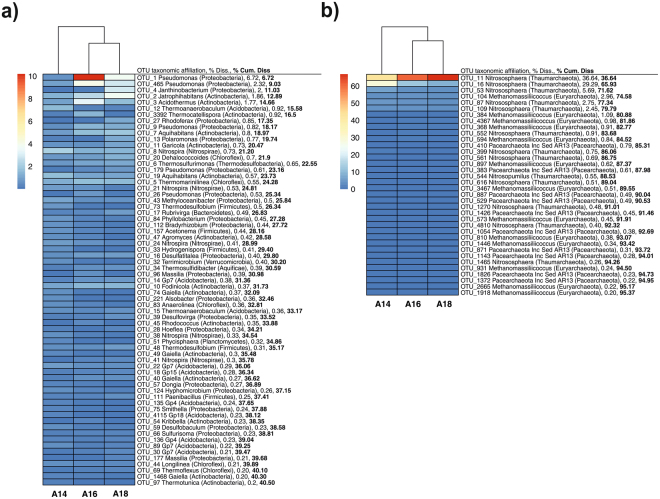
Figure 4.
Heat map showing the relative abundance of top bacterial (a) and archaeal (b) OTUs contributing to differences (SIMPER analysis) in community structures among the studied layers A14 (upper), A16 (intermediate) and A18 (lower). Only OTUs contributing ≥0.2% of dissimilarity among layers were selected for heat map representation and they were represented in decreased order of dissimilarity contribution. Sites were clustered using UPGMA dendrogram based on Canberra distances. Percentages to the right of each OTU indicate the percent dissimilarity contributed by each OTU (% Diss.) and the cumulative percent dissimilarity among layers (% Cum. Diss.). Color legend and scale (%) are provided in the figure.

