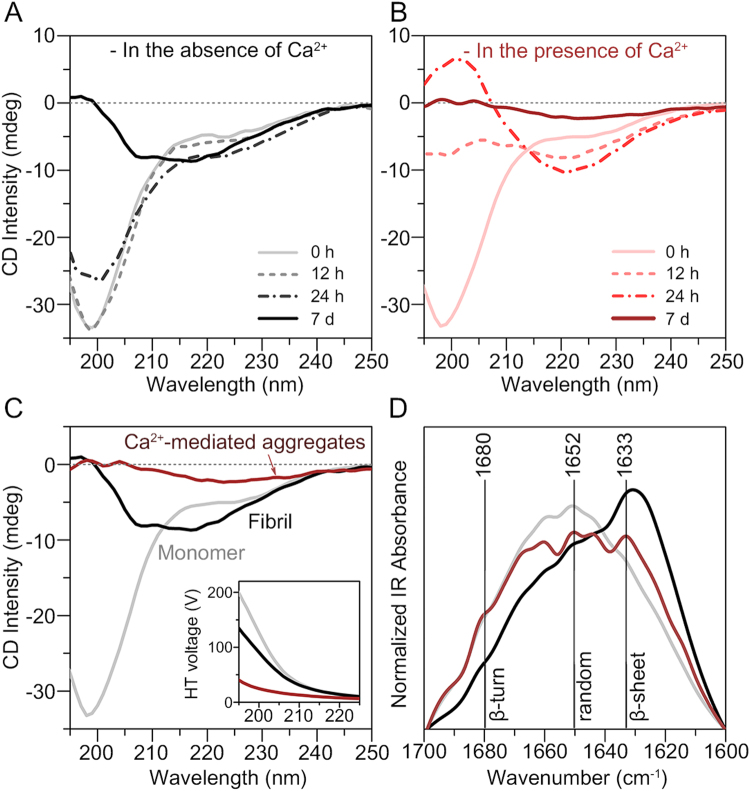
Figure 3.
Secondary structural analysis of the αSyn aggregates formed through Ca2+ mediation. Time-resolved CD spectra of two-fold diluted αSyn samples (30 μM) incubated (A) in the absence of Ca2+ and (B) in the presence of 1.5 mM Ca2+. All incubated αSyn samples included a residual Ca2+ concentration of ~10 μM. (C) CD spectra and (D) IR spectra of the αSyn monomers (gray), fibrils (black), and aggregates formed through Ca2+ mediation (brown). The inset in the image of CD spectra shows HT voltage of the samples, which was simultaneously measured during CD measurements.

