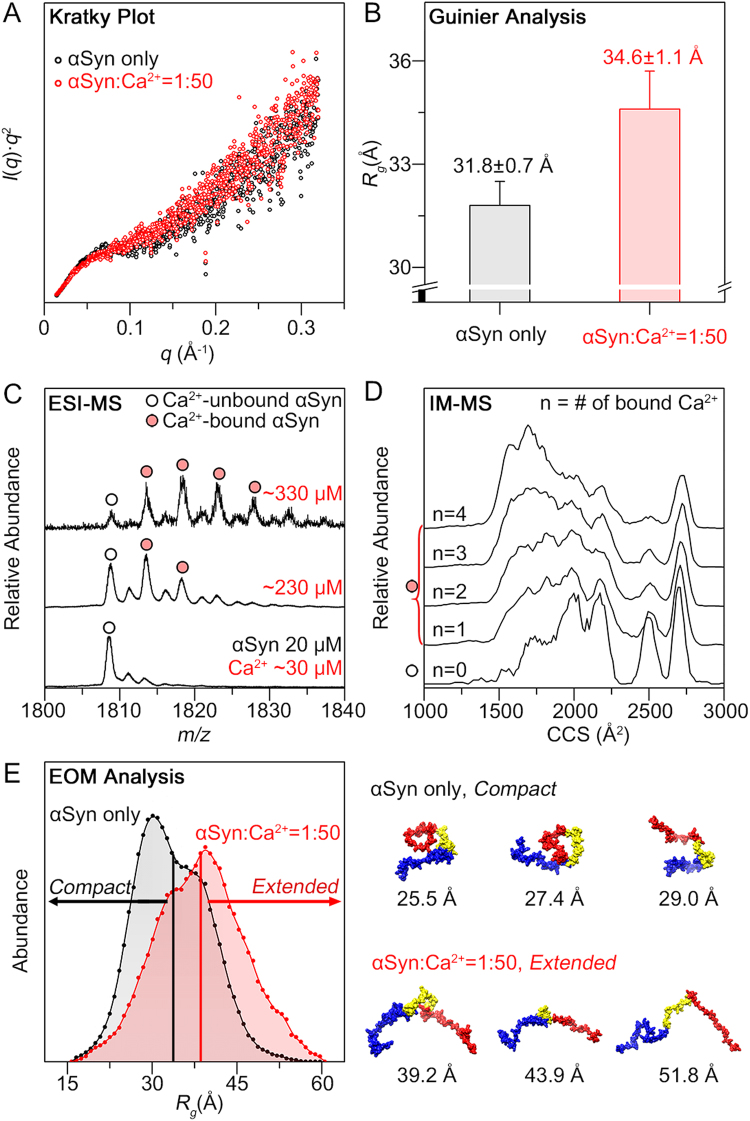
Figure 4.
Conformational transition of αSyn monomers induced by Ca2+. (A) Kratky plots of αSyn (200 μM) in the absence and presence of 50-equivalent Ca2+ (10 mM). (B) Rg values obtained by the Guinier analysis of SAXS scattering curves. (C) ESI-mass spectra of αSyn (20 μM) in the + 8 charge state with increasing Ca2+ concentration. The residual Ca2+ concentration of the αSyn sample without CaCl2 (bottom) was ~30 μM and all Ca2+ concentrations were the sum of the residual Ca2+ and added CaCl2. In the mass spectra, Ca2+-unbound and bound αSyn were marked with empty circles and filled circles, respectively. (D) IM-MS spectra of αSyn in the + 8 charge state with increasing number (n) of bound Ca2+ ions ([αSyn + nCa + (8–2n)H]8+). (E) Rg distribution of the structural ensemble (50 structures) obtained using EOM and some representative structures of the ensemble with the Rg values. Residues that are shown in blue, yellow, and red indicate the N-terminal, NAC, and C-terminal regions, respectively.

