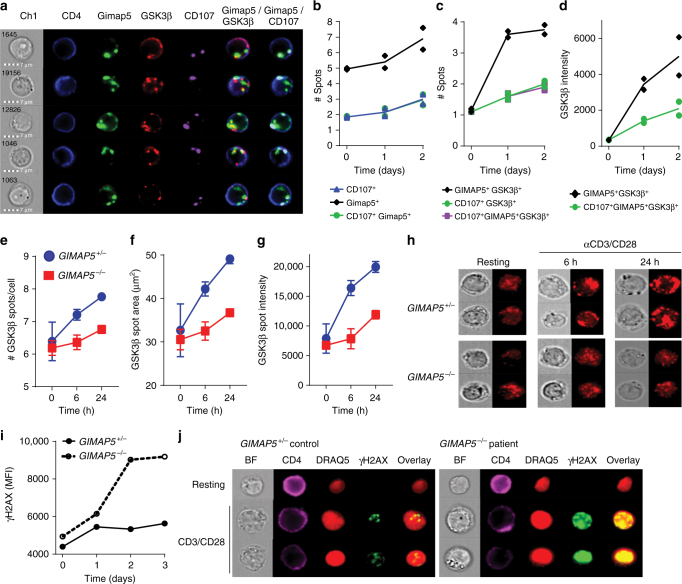
Fig. 8.
Human GIMAP5−/− T cells show impaired GSK3β sequestration and increased DNA damage. a–d Colocalization and spot analysis of GIMAP5+, GSK3β+, and CD107+ vesicles in primary CD4+ T cells isolated from healthy controls at a resting state (day 0) or after αCD3/αCD28 stimulation for 1–2 days (representative images from day 1 shown) using ImageStream analysis. e–h ImageStream analysis of GSK3β-specific vesicle association in control or GIMAP5−/− patient CD4+ T cells restimulated with αCD3/αCD28 after primary expansion. Data depicts e GSK3β+ spot number, f GSK3β intensity therein, and g spot area in live CD4+ T cells at 0, 6, or 24 h of αCD3/αCD28-restimulation. Data represent mean values ± SD. h Representative images of GSK3β vesicular association in control and GIMAP5−/− CD4+ T cells taken using a 60× objective. Analysis of DNA damage response (γH2AX) in control of GIMAP5sph/sph CD4+ T cells after i 1–3 days or j 2 days restimulation with αCD3/αCD28. Data represents mean values of a single experiment performed in duplicate and repeated twice. ImageStream data represent average values of >500 CD4+ T cells per experiment. BF bright field

