Fig. 3.
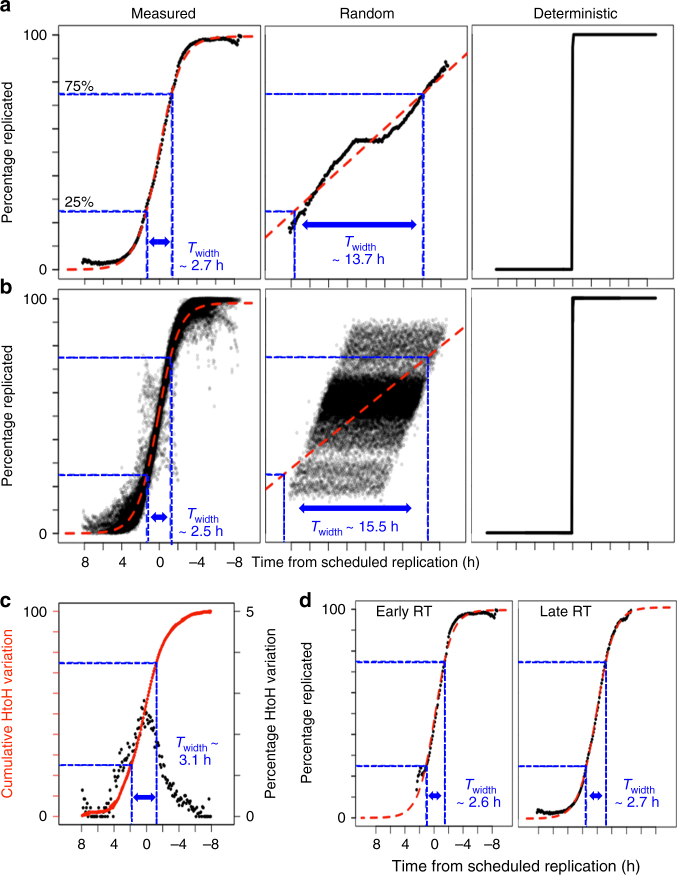
Measuring single-cell replication variability. a Cell-to-cell variability vs. “time from scheduled replication” in hours. The mean across all 50 kb bin positions is plotted for each 0.1 h interval on the x axis and the red line is the sigmoid fit. Control models of random vs. deterministic replication are shown for comparison. b Within cell variability across the genome plotted for each single-cell independently, similar to a. c Homolog-to-homolog variability vs. “time from scheduled replication”. The black scatter plot measures percentage of bins that show homolog asynchrony (right y axis) for each 0.1 h interval on x axis. The overlapping solid and dotted red line are the cumulative sum of the variability and it’s sigmoid fit, respectively (left y axis). d Cell-to-cell variability for early (RT > 0) vs. late replicating regions (RT < 0)

