
Figure 2.
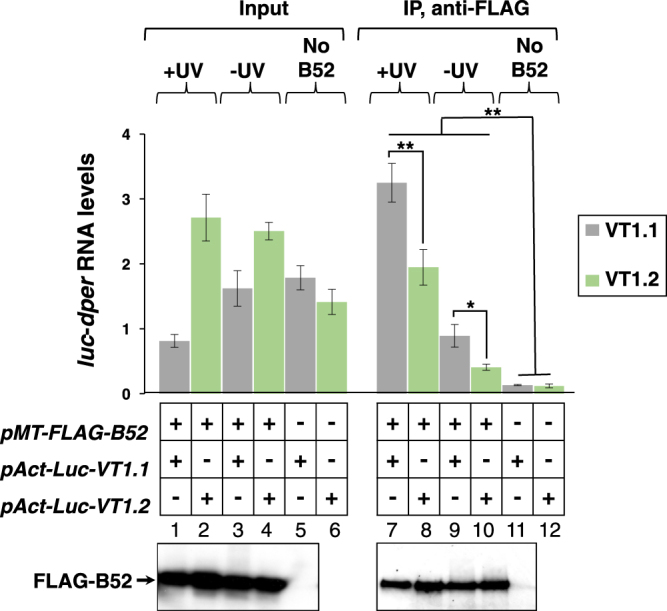
Enhanced binding of B52 to transcripts containing the VT1.1 haplotype compared to the VT1.2 version. Drosophila S2 cells were transfected with either the the pAct-Luc-VT1.1 (VT1.1) or pAct-Luc-VT1.2 (VT1.2) plasmid, in the presence (+) or absence (−) of a plasmid expressing FLAG-B52, as indicated. After UV irradiation (+UV) or mock-treatment (−UV), cells were homogenized in 350 μl of lysis buffer. A fraction of the cell extract (100 μl) was used to measure the relative levels of Luc-dper transcripts (Input; top left) and FLAG-B52 using immunoblotting (Input; bottom left, lanes 1–5). The remainder of the cell extract was subjected to immunoprecipitation (IP) in the presence of anti-FLAG antibodies. Following IP, an aliquot was used for immunoblotting of FLAG-B52 (IP; bottom right, lanes 7–11), and the remainder used to measure the relative levels of Luc-dper transcripts bound to B52 (IP; top right). For the immunoblots shown, the left panel (lanes 1–5) and the right panel (lanes 7–11) come from two different gels (for images of the full-length blots, see figure S1). Note that for the set of immunoblots shown we did not include extracts prepared from the control samples expressing pAct-Luc-VT1.2 in the absence of FLAG-B52 (lanes 6 and 12). For quantitation of transcript levels, results from three experiments were averaged. The values for Luc-dper mRNA bound to B52, either with or without cross-linking, was significantly higher for VT1.1 compared to VT1.2, even though the starting amount of VT1.2 RNA was generally higher compared to VT1.1 (Input); the following p values were determined for IP samples comparing VT1.1 and VT1.2 values: +UV, 0.0035; −UV, 0.043. Also, the levels of Luc-dper transcripts present in immune complexes for cells expressing FLAG-B52 were significantly higher compared to negative control samples derived from cells not expressing FLAG-B52. The following p values were obtained comparing either Luc-VT1.1 or Luc-VT1.2 transcript levels in immune complexes expressing FLAG-B52 (lanes 7–10) compared to control samples not expressing FLAG-B52 (lanes 11 and 12); VT1.1/+UV vs VT1.1/No B52, 0.003; VT1.1/−UV vs VT1.1/No B52, 0.01; VT1.2/+UV vs VT1.2/No B52, 0.005; VT1.2/−UV vs VT1.2/No B52, 0.0004. *p < 0.05; **p < 0.01; two-tailed t-test.