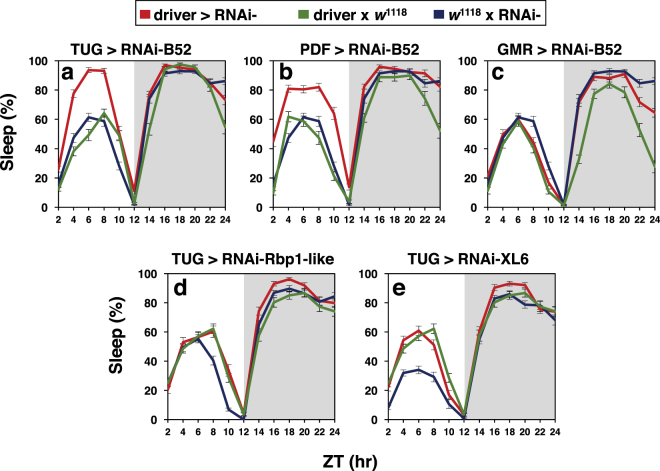
Figure 5.
Modulation of daily sleep levels is not a shared feature of all SR proteins. (a–e) Young male progeny from the indicated crosses (top of panels) were kept at 18 °C and entrained for 5 days in 12 hr:12 hr light/dark (LD) cycles followed by several days in constant darkness (DD). Shown are the daily sleep levels (averaged over the last 3 days of LD). For each genotype, data from 16 individual flies was used to generate the graphs shown in each panel. The driver and SR protein targeted by RNAi are indicated. For RNAi-B52, the V101740 line is shown. The following p values (ANOVA) were determined for driver x RNAi (red) compared to both control crosses (blue and green): [daytime values from ZT0-12; panel (a), 0.0040; panel (b), 0.00039; panel (c), 0.92; panel (d), 0.48; panel (e), 0.28; nighttime values from ZT12–24; panel (a), 0.36; panel (b), 0.015; panel (c), 0.26; panel (d), 0.021; panel (e), 0.13]. The corresponding daily activity profiles are shown in Figure S4.

