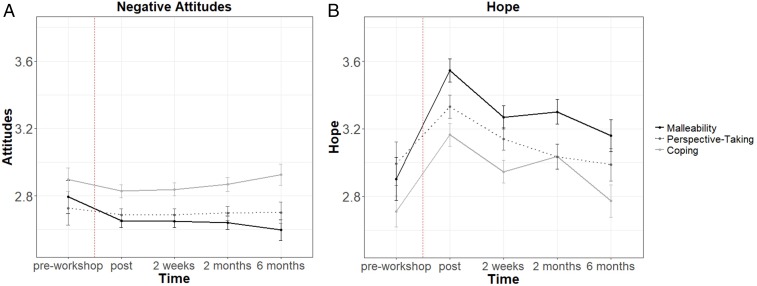
Fig. 1.
Average ratings of participants’ negative attitudes (A) and hope (B) at each point for all three conditions, obtained from the longitudinal model. Error bars are SEs. For the sake of simplicity, the distance between points has been constrained to be equal despite the differences in time. The reported slopes account for the actual differences in time between points (in weeks).

