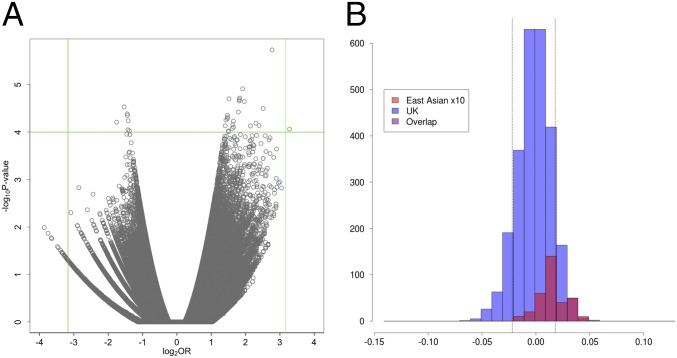
Fig. 3.
(A) Volcano plot for female lower (more European) extreme PC2 profile. Green lines show the upper and lower thresholds for ORs and the upper threshold for the P values. Only the green dot satisfies the criteria for further analysis. (B) Distribution of PC values for the PC2 profile in UK (PoBI) and East Asian individuals, with the East Asian distribution magnified in size by 10 for visualization purposes. Dotted lines show the thresholds for the upper and lower 10% of individuals.

