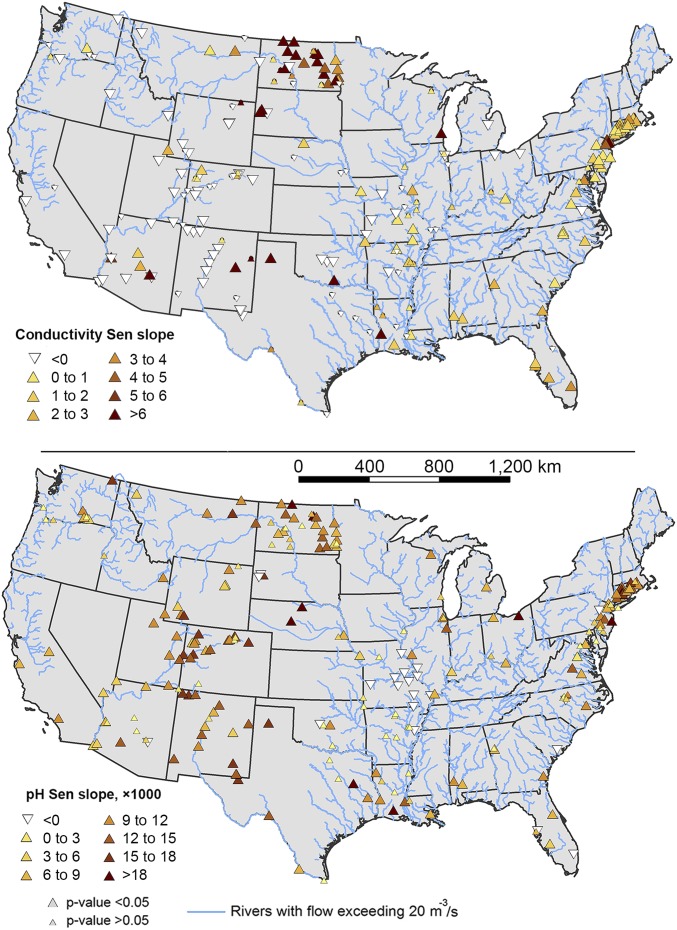
Fig. 1.
Maps showing locations of increasing, decreasing, and/or no trends in specific conductance and pH in stream water throughout the continental United States. Streamlines represent all conterminous US rivers with mean annual discharge exceeding 20 m3/s (47).

