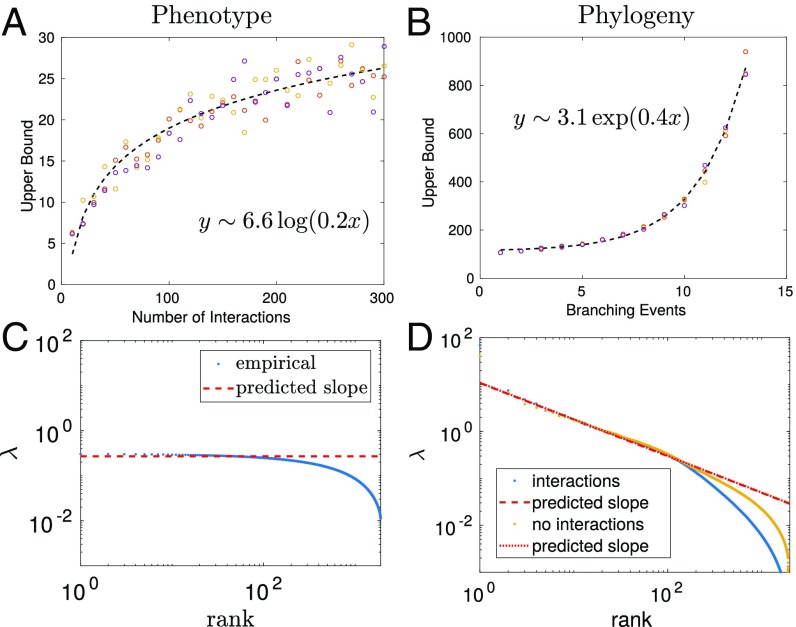
Fig. 4.
(A and B) Largest eigenvalue obtained in simulations with (A) only structural interactions with strength 1.0 and (B) only phylogeny. Lines of best fit are shown. (C) Eigenvalue distribution obtained in simulations from Fig. 3 with just structural interactions, where the predicted slope is zero. (D) Comparison of eigenvalue distributions obtained in simulations with (yellow) phylogeny and (blue) phylogeny and structural interactions. The presence of interactions does not alter the power law, but does affect the small eigenvalue behavior. The lines of best fit are constrained using , where is from Eq. 1.

