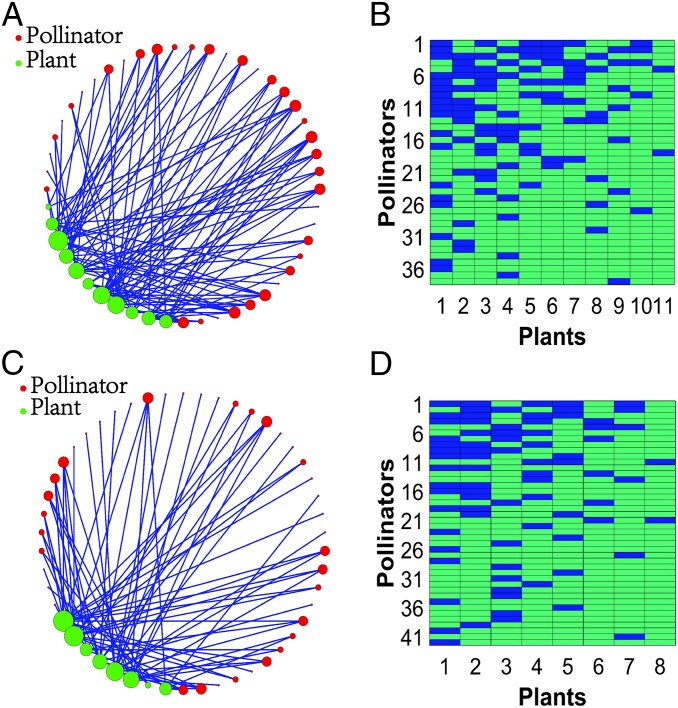
Fig. 2.
Network structure of two empirical mutualistic networks from real data. A and B correspond to network . C and D correspond to network . The plants in A and C are marked as green, while the pollinators are marked as red. B and D are the matrix representations of networks and , respectively. The blue blocks indicate that the corresponding pollinator and plant have a mutualistic connection. Column and row numbers correspond to individual plant and pollinator species. Species are ordered according to their number of interactions.

