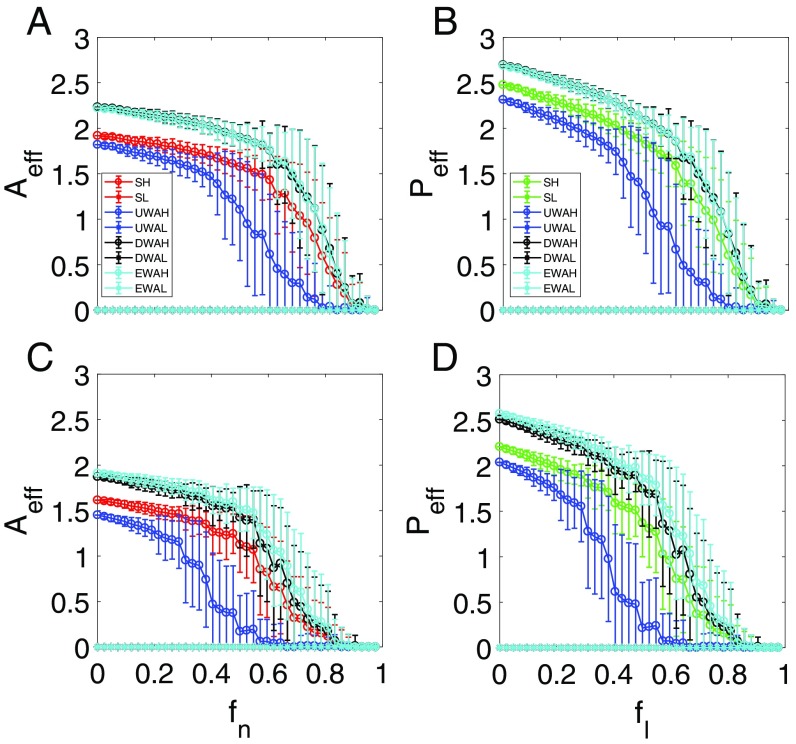
Fig. 4.
Resilient functions with a tipping point. For networks (A and B) and (C and D), ensemble-averaged pollinator abundance (A and C) vs. , the fraction of removed pollinators, and ensemble-averaged plant abundance (B and D) vs. , the fraction of removed mutualistic links corresponding to the value of in A and C. The legends are the same as in Fig. 3. The notations SH and SL stand for the high and low initial values of the original average species abundance, respectively. UWAH, UWAL, DWAH, DWAL, EWAH, and EWAL denote unweighted average high, unweighted average low, degree-weighted average high, degree-weighted average low, eigenvalue-weighted average high, and eigenvalue-weighted average low, respectively. The parameters are , , , , , , and . Before (or for plants) reaches unity, a tipping point associated with total collapse of the system occurs at which the species abundances are diminished.

