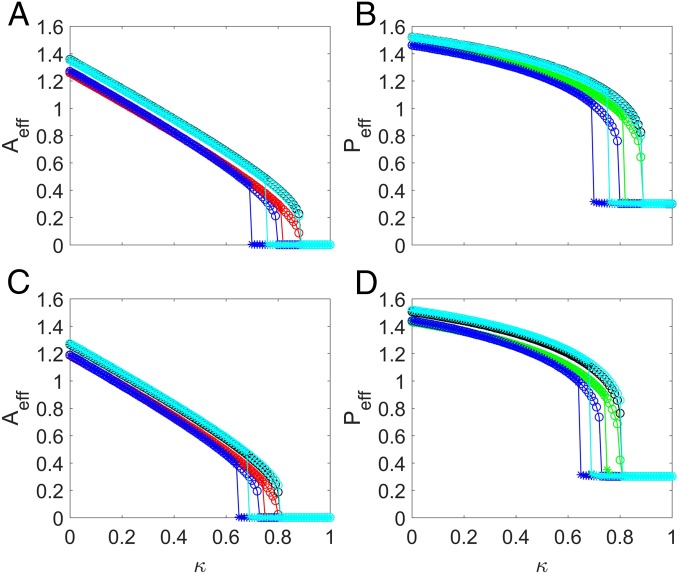
Fig. 5.
Predicting tipping point triggered by an increase in pollinator mortal (decay) rate. For networks (A and B) and (C and D), resilience functions exhibit a tipping point as the pollinator decay rate is continuously increased. The red and green curves are the average pollinator (A and C) and plant (B and D) abundances from the original networks, while the blue, black, and cyan curves in all of the panels are the results from the reduced system using averaging methods i–iii, respectively. The parameters are , , , , , and . Note that the network structure remains intact, as no pollinator is removed. As for the case of removing pollinators, the reduced system with averaging method ii or iii is able to predict the onset of the tipping point correctly. Note the occurrence of a hysteresis behavior (predicted by our mathematical analysis).

