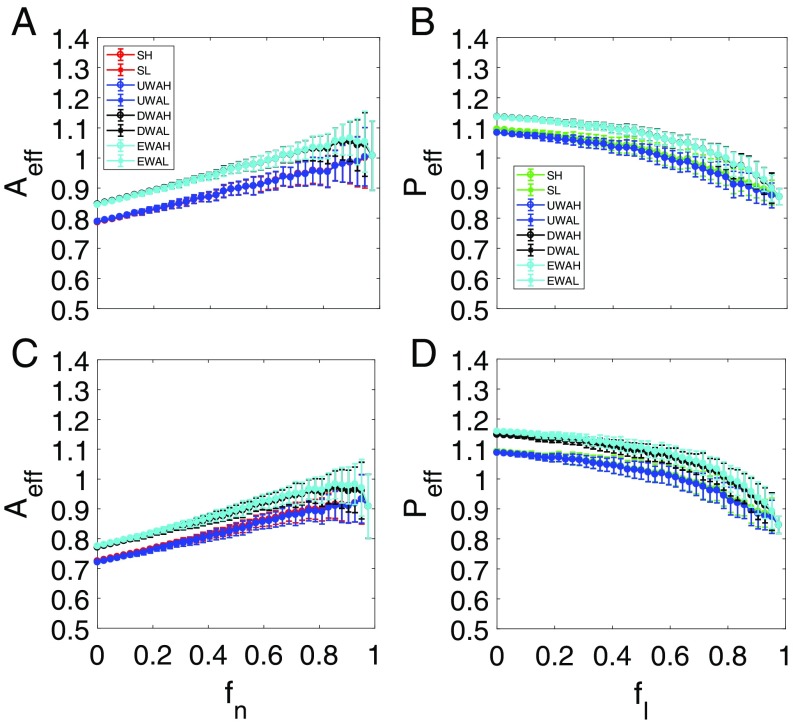
Fig. 9.
Effect of interspecific competition on species abundance in the absence of a tipping point. For networks (A and B) and (C and D), ensemble-averaged pollinator abundance (A and C) vs. and ensemble-averaged plant abundance (B and D) vs. . The legends are the same as in Fig. 3. The notions SH and SL stand for the high and low initial values of the original average species abundance, respectively. UWAH, UWAL, DWAH, DWAL, EWAH, and EWAL denote unweighted average high, unweighted average low, degree-weighted average high, degree-weighted average low, eigenvalue-weighted average high, and eigenvalue-weighted average low, respectively. The intraspecific and interspecific competitions are incorporated into the modeled through and , respectively. The parameters are , , , , , and . The interspecific competition reduces the abundances but has no significant effect on their overall trends of variation.

