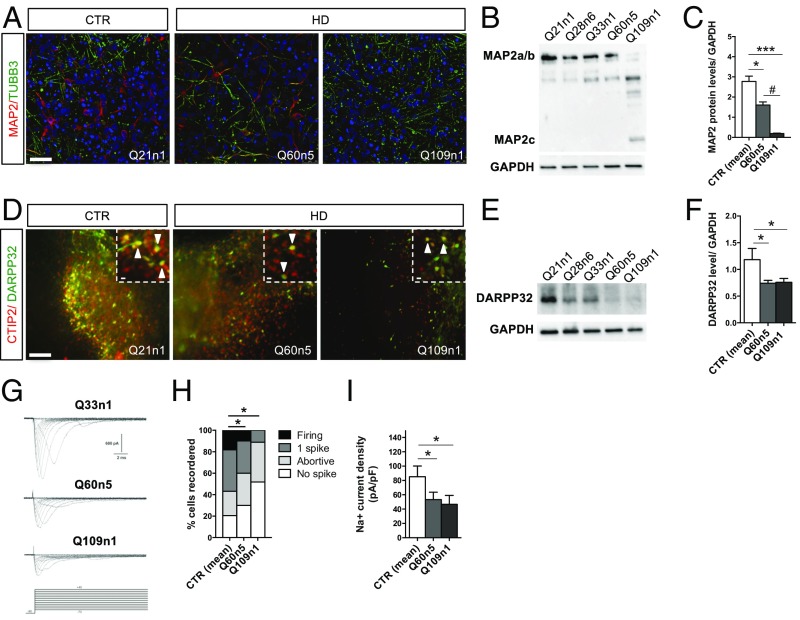
Fig. 3.
Defective striatal terminal differentiation and maturation in HD lines. (A) Immunostaining for TUBB3/MAP2 at DIV30 of differentiation of Q60n5 and Q109n1 and CTR Q21n1. (Confocal images, scale bar, 50 μm.) (B) Representative Western blot for MAP2a/b at DIV30 with corresponding GAPDH levels. (C) Densitometric analysis on Western blot analysis normalized with GAPDH. (CTRs = 2.77 ± 0.74; Q60n5 = 1.61 ± 0.27; Q109n1 = 0.19 ± 0.04; *P < 0.05, ***P < 0.001, #P < 0.05 one-way ANOVA; n = 3 biological experiments, data are represented as mean ± SEM.) (D) Double immunostaining for CTIP2 and DARPP32 at DIV 50 of differentiation. Arrows indicate striatal neurons double positive for CTIP2 (red) and DARPP32 (green). [Scale bar, 100 μm; Insets (crops of the same images), 50 μm.] (E) Representative Western blot for DARPP32 at DIV50 with corresponding GAPDH levels. (F) Densitometric analysis on Western blot analysis. (CTRs = 1.19 ± 0.21; Q60n5 = 0.85 ± 0.29; Q109n1 = 0.18 ± 0.09; *P < 0.05 one-way ANOVA; n = 3 biological experiments, data are represented as mean ± SEM.) (G) Families of Na+ current traces evoked by the protocol (Lower traces) from iPSC-derived striatal neurons differentiated in vitro for 30 d. (H) The graph represents the percentage of cells able to generate 1 spike or firing at DIV30 of differentiation. 62% of CTRs, 53% of Q60n5, and only 8% of Q109 when activated displayed single spike or repetitive firing. (*P < 0.05 one-way ANOVA; n = 3 biological experiments, data are represented as mean ± SEM.) (I) The Na+ current density recorded at −20 mV from the different iPSC-derived neurons. In the graph, each column represents the average of Na+ current density in recorded cells. (Q21n1 plus Q33n1 n = 78; Q60 n = 27, Q109 n = 17, *P < 0.05 one-way ANOVA; n = 3 biological experiments, data are represented as mean ± SEM.)

