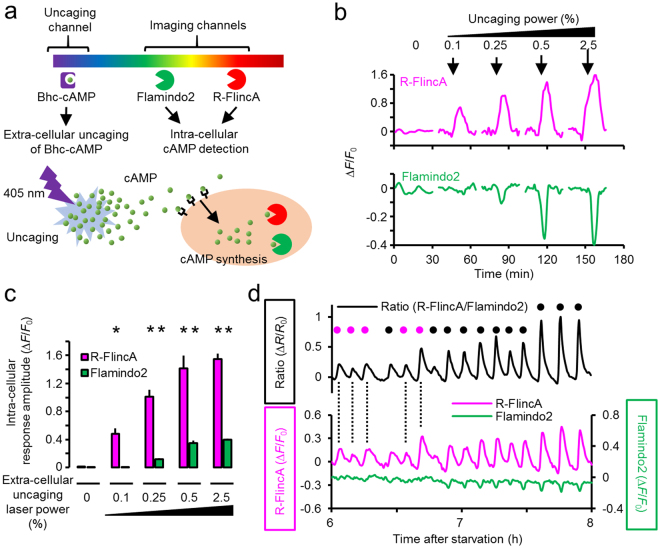
Figure 2.
Increased sensitivity of R-FlincA. (a) Experimental design for dual-colour cAMP imaging in combination with extra-cellular uncaging of Bhc-cAMP37. (b) Representative signal changes for R-FlincA and Flamindo2 in a single D. discoideum cell. Arrows indicate the timing of uncaging (405 nm, 6.7 μsec) with increasing power. (c) Signal changes of R-FlincA and Flamindo2 (absolute values of ΔF/F0) in response to extra-cellularly supplied cAMP with increasing uncaging power. Bars represent +SEM, N = 10 cells for laser power 0, 0.1, and 0.25%; N = 5 for 0.5%; N = 15 for 2.5%. Asterisks represent significant differences compared to the control group (0%) at p < 0.05 (Student’s t test with two-tailed). (d) Spontaneous cAMP dynamics in the population of D. discoideum cells, detected by the ratiometry of R-FlincA and Flamindo2. The small pulse amplitude at early development (magenta circles) is detected with R-FlincA, but not with Flamindo2. Black circles are the large cAMP pulses detected by both R-FlincA and Flamindo2. F0 and R0 is the fluorescence intensity and ratio value at 6 h, respectively. Ratio values were obtained from the pixel-by-pixel calculation. The averaged data in 0.08 mm2 containing ~100 cells.

