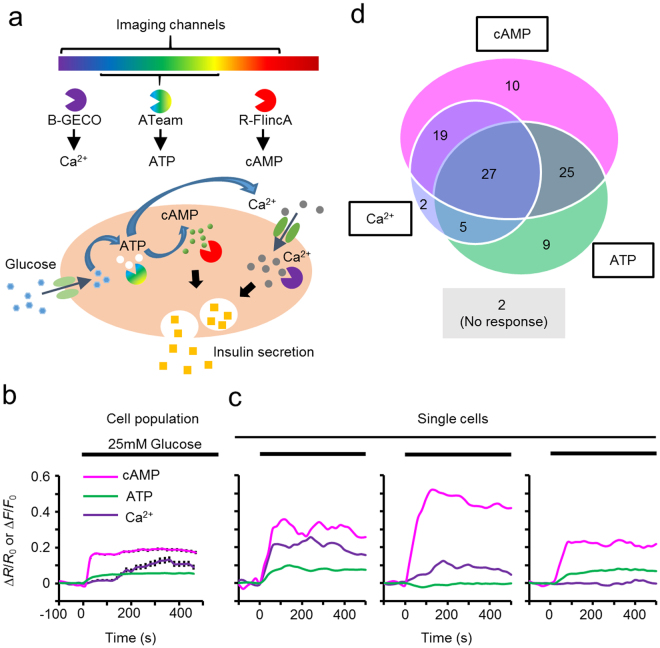
Figure 3.
Triple-function imaging of cAMP, Ca2+, and ATP. (a) Schematic illustration of the triple-function/four-colour imaging in glucose-responsive MIN6 cells. (b,c) Fluorescence signal changes in B-GECO1, ATeam1.03, and R-FlincA in response to glucose. Averaged traces of a population of MIN6 cells Bars represent ± SEM (N = 99 cells). (b) or individual cells (c). (d) A Venn diagram showing the heterogeneous activation of second messengers. Values are percentages of responding cells out of the total cells (Ntotal = 99 cells).

