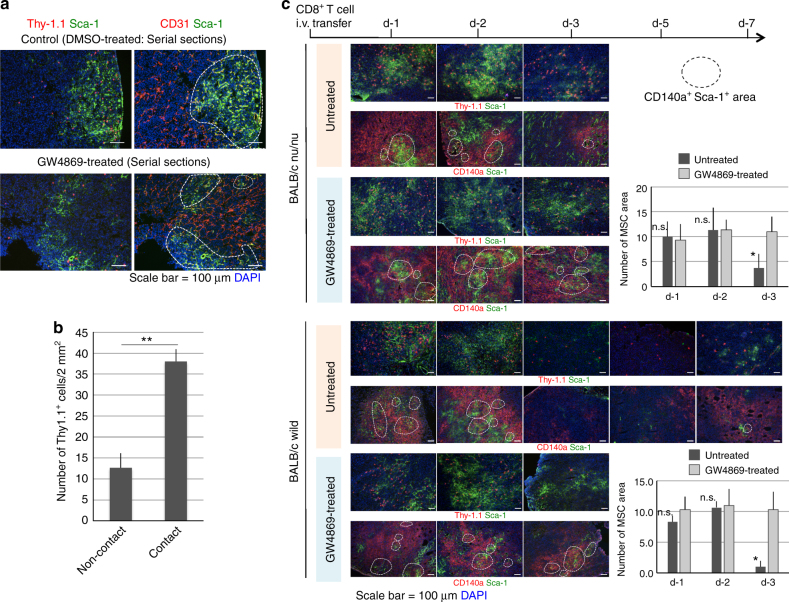
Fig. 7.
Destruction of mesenchymal tumour stroma by tumour-infiltrating CD8+ T cells. a DMSO- or GW4869-treated Thy-1.1+ DUC18 CD8+ T cells were transferred intravenously into CMS5a-bearing BALB/c mice (n = 6 per group). The next day, resected tumours were sectioned and stained with the indicated mAbs and DAPI. Each photo is a representative of 4–5 photos. Upper or lower photos of each group are the photos from the serial sections. The dotted lines show the neovascularization areas. b Consistent with a, CMS5a sections of DMSO-treated Thy-1.1+ DUC18 CD8+ T cell-transferred groups were stained with PE-conjugated Thy-1.1-specific mAb and FITC-conjugated Sca-1-specific mAb, and then the number of Thy-1.1+ cells in contact with/without Sca-1+ cells was counted (**p < 0.01; error bars indicate SEM). The data were analysed by a two-tailed unpaired Student t-test. c At days 1, 2, 3, 5 and 7 after transferring untreated or GW4869-treated Thy 1.1+ DUC18 CD8+ T cells into CMS5a-bearing BALB/c wild-type or nude mice (n = 5 per group), the resected tumours were sectioned and stained with the indicated mAbs and DAPI. Each photo is a representative of 3–4 photos. The dotted circles show MSC areas overlapping with PE fluorescence of CD140a with FITC fluorescence of Sca-1. The number of overlapping areas of the untreated group on day 3 was significantly different from that in the GW4869-treated group in BALB/c nu/nu- and BALB/c wild-type cases (*p < 0.05; n.s. not significant; error bars indicate SEM). The data were analysed by a two-tailed unpaired Student t-test

