Figure 2.
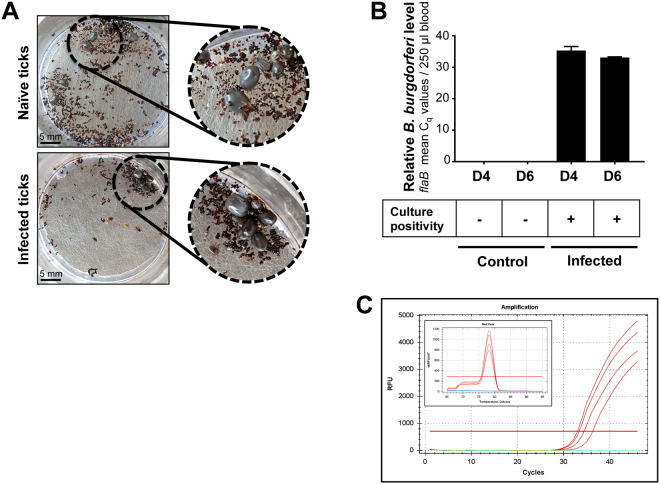
Transmission of B. burgdorferi in the blood using artificial membrane feeding. (A) Feeding of naïve (control) and wild type infectious B. burgdorferi-infected nymphal ticks on the membrane feeder. (B) Relative pathogen burden (as expressed by mean Cq values) obtained with qRT-PCR using primers targeting flaB. Error bars are showing ±SEM. The blood meal samples were collected between days 4–6 after feeding of naïve or infected ticks and used for detection of spirochetes via qRT-PCR or cultured to detect spirochetes via dark-field microscopy. (C) Amplification and specificity of spirochete detection via qRT-PCR. Amplification curves in blood samples are shown as follows: B. burgdorferi-infected ticks (red), naive control ticks (blue) and no DNA (template) controls (green). Inset graph shows a typical melting peak specific for flaB amplification.

