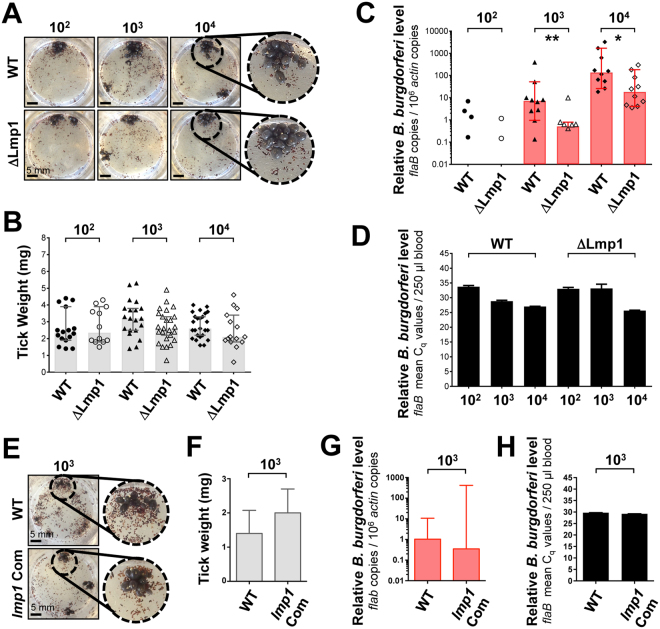
Figure 4.
Acquisition of wild type (WT), lmp1 deletion mutant (∆Lmp1) and lmp1 complemented strain (lmp1 Com) B. burgdorferi using artificial membrane feeding. (A) Representative images show feeding of naïve nymphal ticks on the bovine blood (3 ml), spiked with WT or ∆Lmp1 spirochetes at the concentrations of 102, 103 and 104 cells/ml during every blood change. Scale bar, 5 mm. (B) Weight of engorged nymphs following acquisition of spirochetes. Grey bars indicate median weight of fully engorged ticks feeding on blood infected with different numbers of WT and ∆Lmp1 spirochetes. There was no significant difference in tick weight feeding on WT (solid dot) or ∆Lmp1 (open dot) spirochetes (p > 0.05). Each dot represents a fully engorged tick (n = 12–25). Error bars are showing 95% CI. (C) B. burgdorferi burden in nymphal ticks after acquisition. Significantly decreased median spirochete burden was directly detected by qRT-PCR after feeding on ∆Lmp1-spiked blood meal compared to WT (p < 0.05). Each dot represents a fully engorged tick (n = 10). Error bars are showing 95% CI. (D) Spirochete level in bovine blood meal. The WT and ∆Lmp1 level in blood meal, collected following a blood change, was detected using qRT-PCR (n = 2). There was no difference in spirochete level in blood meal during tick artificial feeding (p > 0.05). Bars represent the mean ± SEM. (E) Representative images showing feeding of naïve ticks on the blood (3 ml) spiked with 103 of WT or lmp1 Com spirochetes per ml during every blood change. (F) Weight of engorged nymphs. Median weight of fully engorged ticks (n = 20) feeding on blood infected with WT and lmp1 Com spirochetes. Error bars are showing 95% CI. (G) Spirochete levels in engorged ticks. Median burden of WT and lmp1 Com acquired in fully engorged ticks are shown. Error bars reflect 95% CI. (H) Spirochete level in bovine blood meal. The WT and lmp1 Com level in blood meal, collected following a blood change, was detected using qRT-PCR (n = 2). There was no difference in spirochete level in blood meal during tick artificial feeding (p > 0.05). Bars represent the mean ± SEM. Tick data shown in this figure originated from nymphal ticks collected after detachment or after day 8 at the completion of an experiment.

