Figure 1.
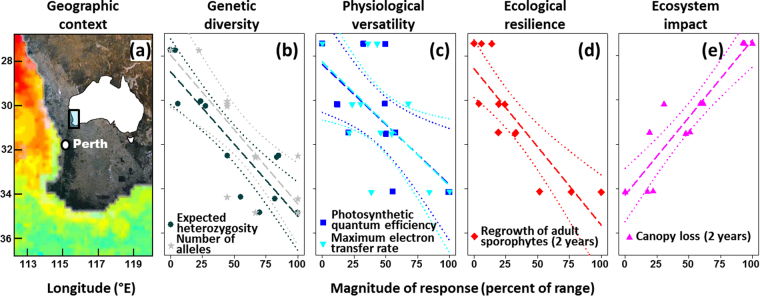
Geographic context and population characteristics for 12 Australian kelp forests. (a) The coastline of southwestern Australia is swept by the poleward flow of the warm Leeuwin Current, which creates a uniform gradient in ocean temperature of 2–3 °C across latitudes from 27°S to 35°S (annual daily mean 21.9 to 19.5 °C, respectively) (Wernberg & Smale, 2009, see also Fig. S1). Prior to the 2011 marine heat wave, kelp forests had their equatorward limit in Kalbarri (27.7°S). (b) Genetic diversity (data range: He 0.269–0.375, Na 12–21)19, (c) physiological versatility (data range: α 2.8–12.4%, ETRmax 2.3–22.2%) and (d) ecological resilience (data range: 1.2–11.1 kelps m−2)14 of kelp forests measured prior to the heat wave. (e) Ecosystem impact (data range: −86–26% change in kelp forest cover) of the 2011-extreme heat wave measured two years after the event. Latitude is shown on the y-axis for all panels and scaled population characteristics on the x-axis for panels (b–e). Lines represent linear regressions (dashed) with associated 95% confidence limits (dotted). Regression coefficients are given in Table S1. The map (Fig. 1a) was generated in Google Earth version 7.1.8.3036 (https://www.google.com/earth/; © CNES/SpotImage, Data SIO, NOAA, US Navy, NGA, GEBCO) and modified using GIMP version 2.8.14 (https://www.gimp.org/). This included drawing and adding the insert map of Australia.

