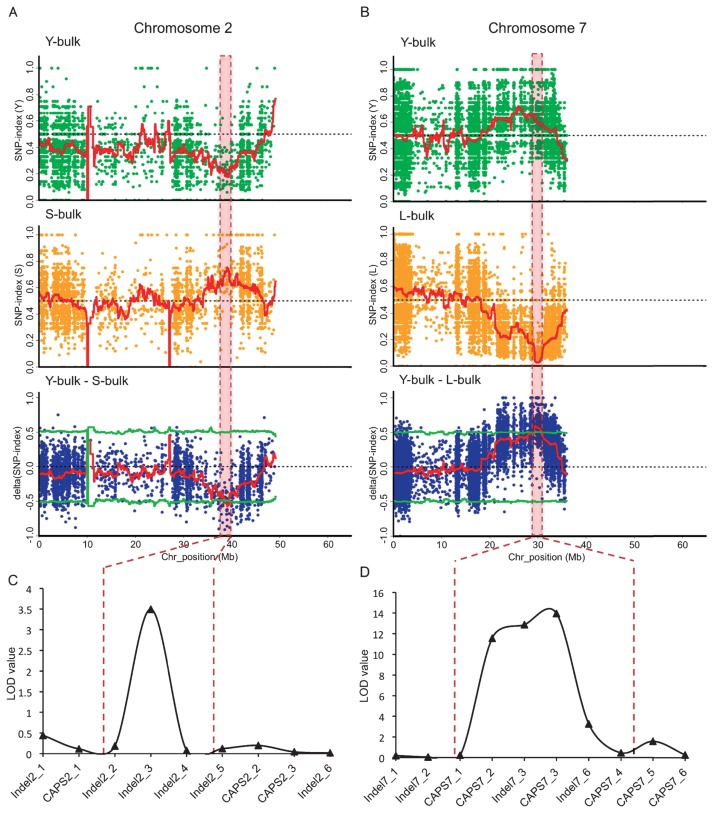
Fig. 2.
QTL-seq applied to F2 population of a cross between Shinanotsubuhime and Yuikogane identifies QTLs for regulating DTH. The SNP-index was calculated based on 1 Mb interval with a 10 kb sliding window analysis (red line). Statistical confidence intervals for the null hypothesis of no QTLs (P < 0.05; green line). Red dotted boxes indicated candidate region identified by QTL-seq analysis. A: Genome-wide comparison of SNPs between the Y-bulk (early heading) and the S-bulk (late heading). SNP-index plots of the Y-bulk (top), S-bulk (middle) and Δ(SNP-index) (bottom) plots of chromosome 2. B: Genome-wide comparison of SNPs between the Y-bulk and the L-bulk. SNP-index plots of the Y-bulk (top), the L-bulk (middle) and the Δ(SNP-index) plot (bottom) of chromosome 7. C: Genetic linkage analysis with CAPS and Indel markers confirmed the location of qDTH2. D: Genetic linkage analysis with CAPS and Indel markers confirmed the location of qDTH7. Scale of y-axis shows lod value and scale of x-axis shows centimorgan (cM).

