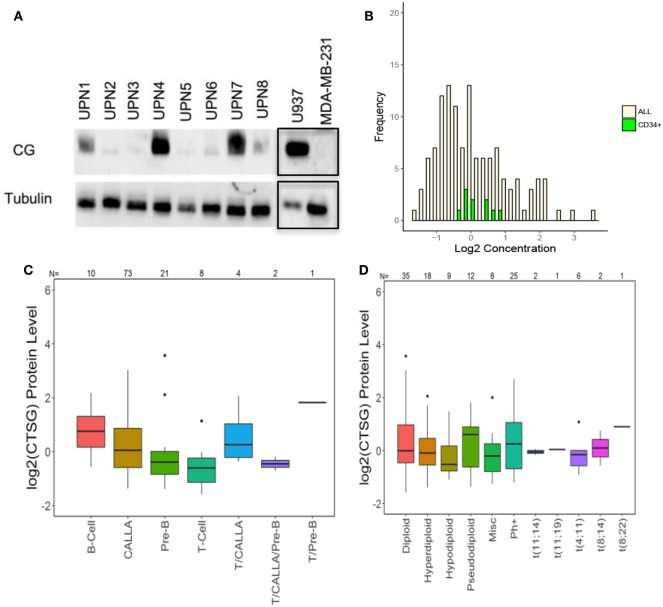
Figure 2.
Cathepsin G (CG) is expressed at the protein level in B-ALL patient samples. (A) Western blots demonstrate CG protein in whole-cell lysates from eight different B-ALL patient samples (Table 1). Gels were loaded with 30 μg of protein. U937 and MDA-MB-231 cell lines were used as positive and negative controls, respectively. Tubulin was used as a loading control. The black boxes outlining the U937 and MDA-MB-231 bands indicate that they were transposed from a different gel that was run in parallel. (B) Reverse-phase protein array was used to quantify protein levels of CG in blasts from 130 newly diagnosed ALL patients (yellow bars). Controls included healthy donor CD34+ progenitor cells (green bars). (C) Box plots show the levels of CG expression in ALL subtypes according to the French–American–British classification. (D) The relationship of CG protein levels is demonstrated with both normal and aberrant cytogenetic subgroups across 130 patient samples. Abbreviations: Misc, miscellaneous.

