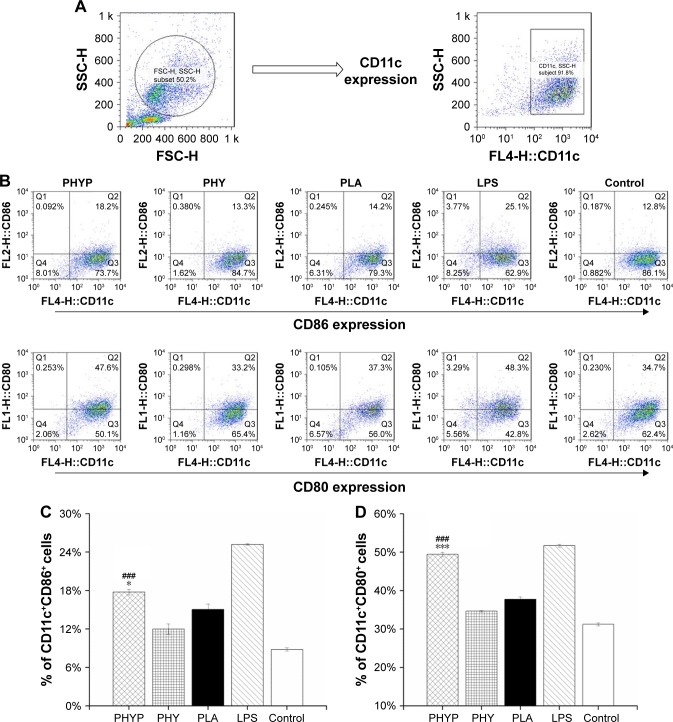
Figure 2.
Surface expression of co-stimulatory molecules by BMDCs upon exposure to PHYP, empty PLA nanospheres and free PHY, determined by flow cytometry (Dot plot representation).
Notes: (A) Gated CD11c-positive BMDC population analyzed. (B) Phenotypes of BMDCs after 48 h of stimulation. (C and D) Percentage of CD11c+CD86+ and CD11c+CD80+ cells upon exposure to PHYP, empty PLA nanospheres, and free PHY; consider LPS as positive control of maturation, and untreated BMDCs as negative controls. Data are expressed as mean ± SEM (n=3). ###p<0.001 vs PHY, *p<0.05 and ***p<0.001 vs the PLA group.
Abbreviations: BMDCs, bone marrow dendritic cells; CD, cluster of differentiation; LPS, lipopolysaccharide; PHY, pachyman; PHYP, PHY-encapsulated PLA; PLA, poly(D,L-lactic acid); SEM, standard error of the mean.

