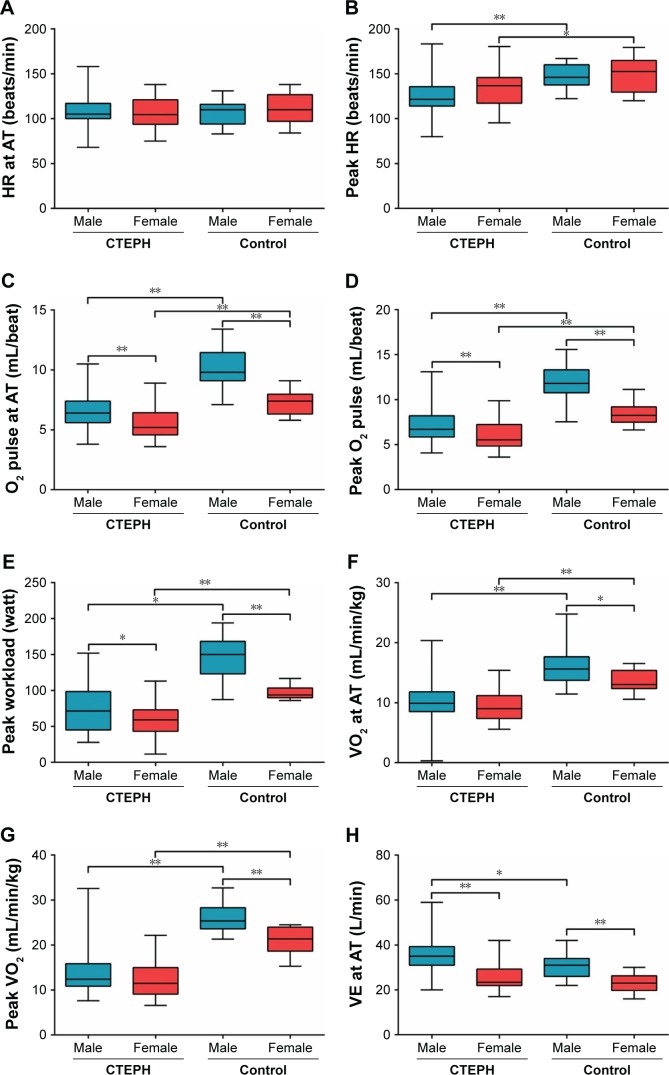
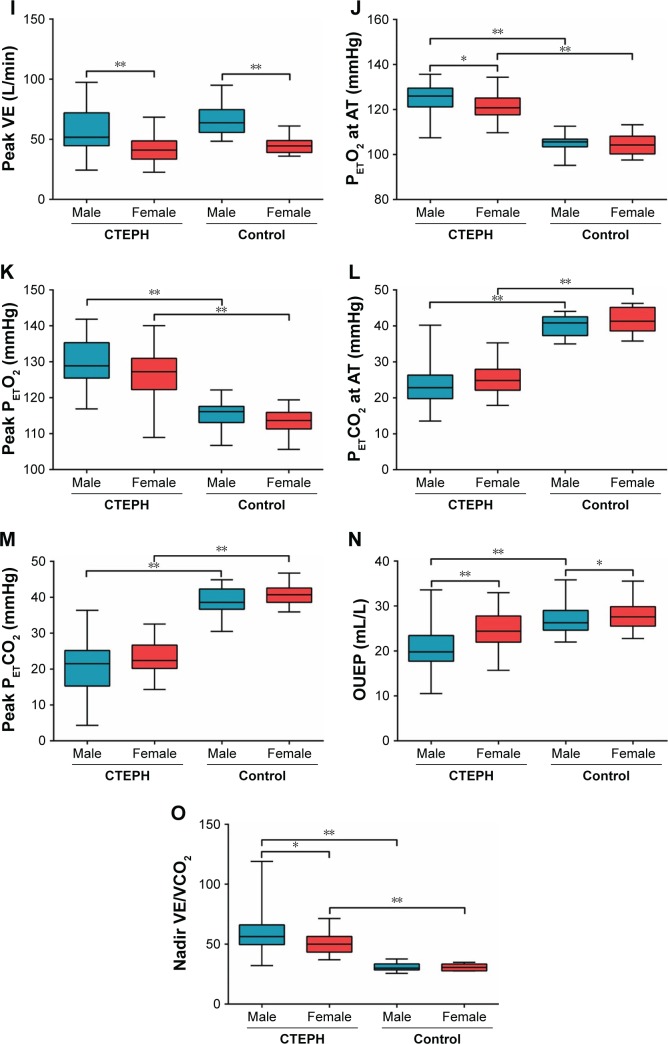
Figure 1.
(A–O). Comparison of CPET parameters in CTEPH and control groups.
Note: *P<0.05 and **P<0.01.
Abbreviations: AT, anaerobic threshold; CPET, cardiopulmonary exercise testing; CTEPH, chronic thromboembolic pulmonary hypertension; HR, heart rate; OUEP, oxygen uptake efficiency plateau; PETCO2, end-tidal partial pressure of CO2; PETO2, end-tidal partial pressure of O2; VCO2, carbon dioxide output; VE, minute ventilation; VE/VCO2, minute ventilation/carbon dioxide output; VO2, oxygen uptake.


