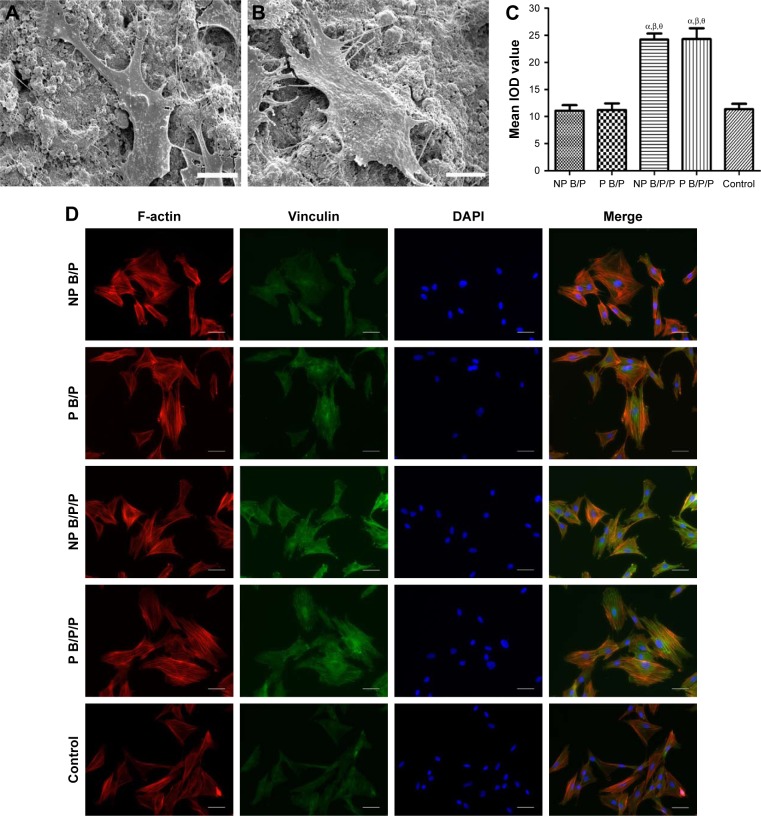
Figure 4.
Assessment of BMSC adhesion to the printed scaffolds.
Notes: Scanning electron microscopy analysis of the adhesion status of BMSCs on P B/P scaffolds (A) and P B/P/P scaffolds (B) at 24 h after seeding; scale bars: 10 μm. (C) Quantitative analysis of the integral optical density value for vinculin fluorescence for BMSCs seeded on NP B/P scaffolds, P B/P scaffolds, NP B/P/P scaffolds, and P B/P/P scaffolds. Results are mean ± standard deviation (χ ± SD), n=3; αP<0.05 vs NP B/P scaffolds; βP<0.05 vs P B/P scaffolds; θP<0.05 vs cell culture plates. (D) Representative images of immunofluorescence staining for F-actin (red), vinculin (green), and nuclei (4′,6-diamidino-2-phenylindole, blue) in BMSCs seeded on scaffolds or cell culture plates (control) at 24 h after seeding; scale bars: 50 μm.
Abbreviations: BMSCs, bone marrow-derived mesenchymal stem cells; IOD, integral optical density; NP B/P, nonprinted biphasic calcium phosphate/polyvinyl alcohol; NP B/P/P, nonprinted biphasic calcium phosphate/polyvinyl alcohol/platelet-rich fibrin; P B/P, printed biphasic calcium phosphate/polyvinyl alcohol; P B/P/P, printed biphasic calcium phosphate/polyvinyl alcohol/platelet-rich fibrin.

