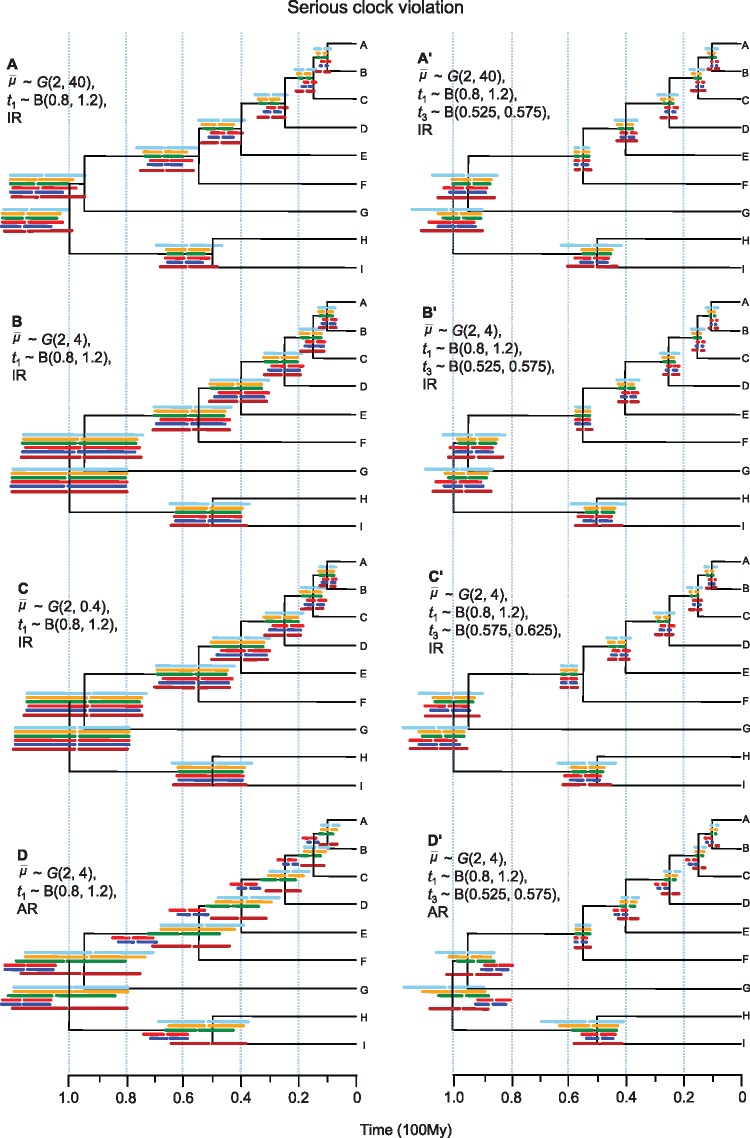
Figure 2.
Posterior divergence time estimates from simulated data for different combinations of rate prior, calibration strategy and rate-drift model, when the clock is seriously violated. The tree shown is the true timetree. Horizontal bars represent the 95% highest posterior density (HPD) intervals for the six partition schemes. These are (from top to bottom): (i) concatenation (C), 1 single partition; (ii) codon positions (CP, 2 partitions); (iii) PartitionFinder (PF, variable partitions); (iv) gene (G, 50 partitions); (v) both gene and codon positions (GCP, 100 partitions); and (vi) ClockstaR (CS, variable partitions). The gap within the bar represents the posterior mean. The time estimates and their intervals are averages over the 100 replicates. IR  independent-rates model, AR
  autocorrelated-rates model.

