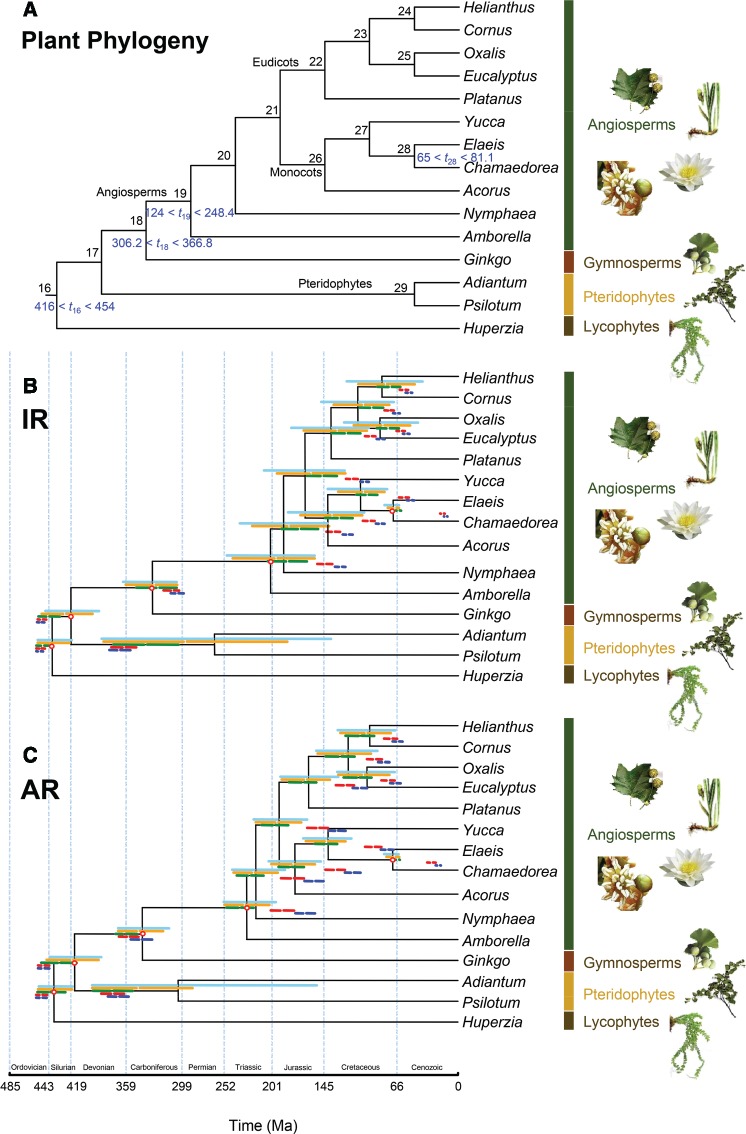
Figure 4.
A) Phylogeny of 15 plant species, based on Magallon et al. (2013) and Ruhfel et al. (2014) with fossil calibrations. Nodes are numbered from 16 to 29. Fossil calibrations for five nodes are shown in blue next to the nodes. The fossil bounds are soft, with 5% probability for the true age to be outside the bounds (2.5% probability on each side). The calibrations are from Clarke et al. (2011) and Zanne et al. (2014). B) Posterior divergence times for the plant phylogeny using six partition schemes. The independent-rates model (IR) was used. Horizontal bars represent the 95% HPD intervals with gaps denoting the posterior mean. The partition schemes are (from top to bottom): (i) concatenation and ClockstaR (C and CS, 1 partition); (ii) codon positions (CP, 2 partitions); (iii) PartitionFinder (PF, 11 partitions); (iv) gene (G, 78 partitions); and (v) both gene and codon positions (GCP, 156 partitions). The timetree shown in black was estimated using scheme C (1 partition). Calibrated nodes are indicated by red circles. C) Same as B using the autocorrelated-rates model (AR).

