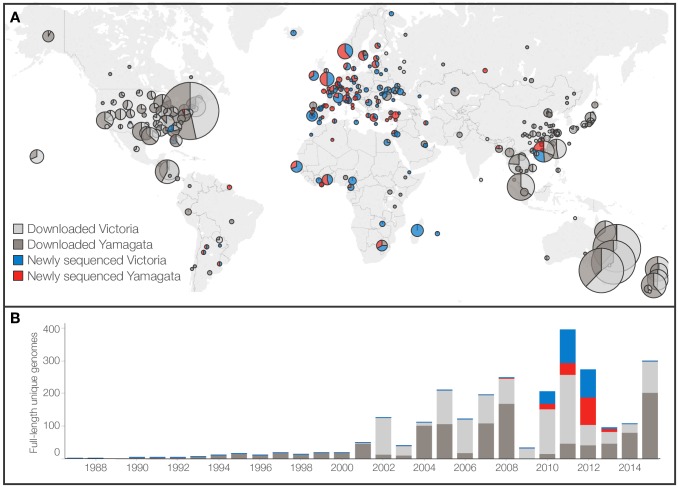
Fig 1. Source and distribution of available influenza B virus full genomes.
(A) Geographic source and (B) temporal distribution of 2,651 unique complete genomes analyzed in this study. Circle areas are proportional to the number of unique viruses originating from a location; smallest circle size represents 1 genome, largest circle size represents 332 genomes. Pie chart fractions reflect proportion of unique full genomes that were either newly generated in this study or downloaded from IVR and GISAID (on 25 August 2015). Viruses are classified as Victoria- or Yamagata-lineage by HA gene.

