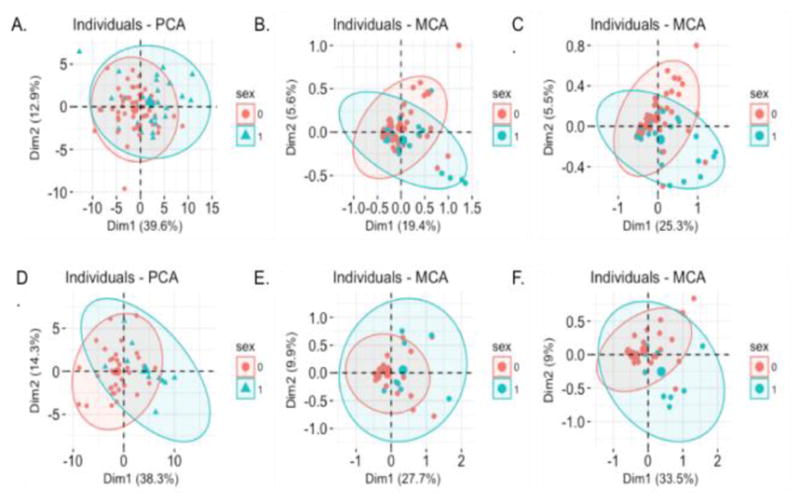
Fig. 2.

Distribution of individuals by sex along the first two components from equations (1), (2), and (3). Red and blue indicate 95% confidence ellipses for females and males respectively. (A) xCT_pca for glaucoma. (B) xPheWAS_mca for glaucoma. (C) xProWAS_mca for glaucoma. (D) xCT_pca for TED. (E) xPheWAS_mca for TED. (F) xProWAS_mca for TED.
