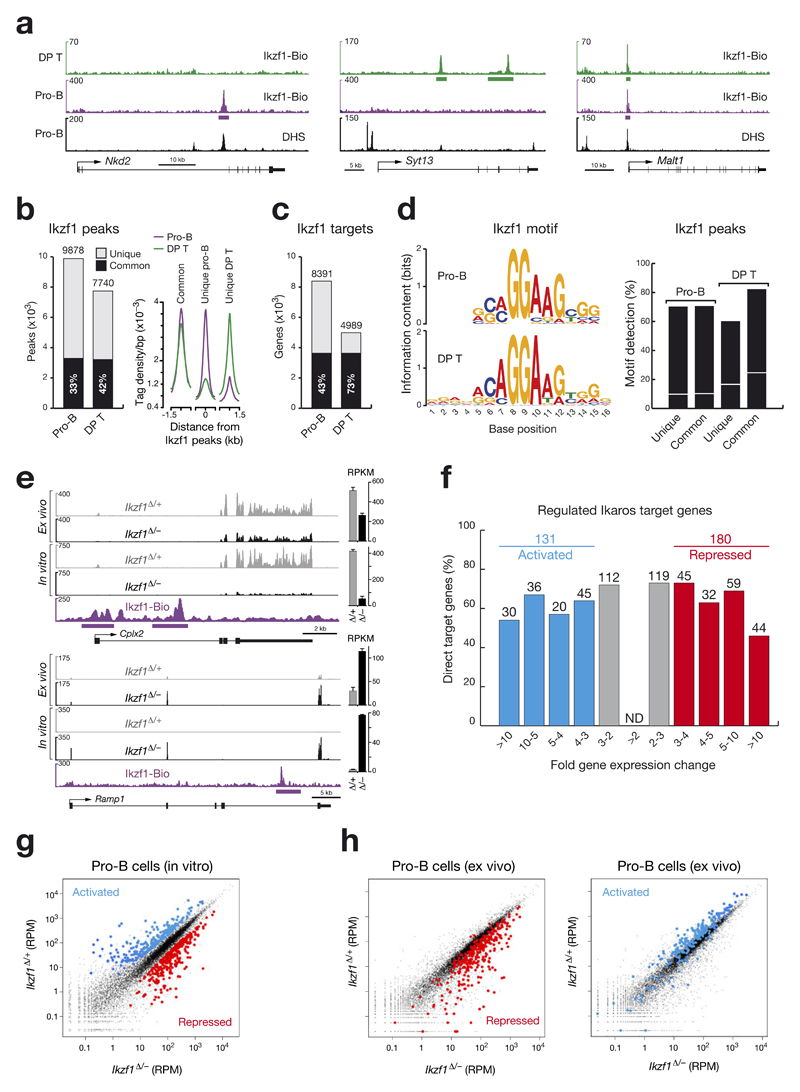
Figure 3. Identification of regulated Ikaros target genes in pro-B cells.
(a) Ikaros binding at unique and common sites in pro-B cells and CD4+CD8+ double-positive (DP) thymocytes. Ikaros-binding sites were identified by Bio-ChIP-sequencing of Ikzf1ihCd2/ihCd2 Rosa26BirA/BirA Rag2–/– pro-B cells (purple) and Ikzf1ihCd2/ihCd2 Rosa26BirA/BirA DP T cells (green). Genes with unique and common Ikaros-binding sites are shown together with their DNase I hypersensitive (DHS) sites20, exon-intron structure and a scale bar shown in kilobases (kb). Bars below the ChIP-seq track indicate Ikaros-binding regions identified by MACS peak calling. (b) Number and overlap of Ikaros peaks in pro-B and DP T cells. Total numbers of 9,878 and 7,740 Ikaros peaks with an overlap of 3,293 common peaks (black bar) were identified in pro-B and DP T cells, respectively, by using a p-value of < 10-10 for peak calling. Average sequence tag density profiles aligned at the center of the Ikaros peaks are shown for common and unique Ikaros-binding sites in the two cell types (right). (c) Identification of common and unique Ikaros target genes in pro-B and DP T cells by peak-to-gene assignment as described20. (d) Consensus Ikaros recognition sequence identified by de novo motif discovery in pro-B and DP T cells. The respective motifs had E-values of 1.8x10-59 (pro-B) and 7.8x10-142 (DP T) and were detected at the indicated frequency (%) in common and unique Ikaros peaks of pro-B and DP T cells, respectively (right). The same motifs were found in random DNA sequences at the frequency indicated by a white line. (e) Expression of the two regulated Ikaros target genes Cplx2 and Ramp1 in short-term in vitro cultured and ex vivo sorted pro-B cells of Cd79a-Cre Ikzf1fl/– (Ikzf1Δ/–; black) and Cd79a-Cre Ikzf1fl/+ (Ikzf1Δ/+; grey) mice, as determined by RNA-seq. Normalized expression values are indicated as RPKMs (plus SEM) to the right. Ikaros peaks were identified by Bio-ChIP-seq. (f) Identification of activated and repressed Ikaros target genes in short-term cultured pro-B cells. The number and percentage of Ikaros target genes are shown for the indicated fold gene expression differences between experimental Ikzf1Δ/– and control Ikzf1Δ/+ pro-B cells. For evaluation of the RNA-seq data, see Online Methods. Activated and repressed genes were further selected for an RPKM value of > 5 in control Ikzf1Δ/+ pro-B cells (activated) or Ikzf1Δ/– pro-B cells (repressed), respectively (Supplementary Table 1). ND, not determined. (g) Scatter plot of gene expression differences observed between in vitro cultured Ikzf1Δ/– and Ikzf1Δ/+ pro-B cells. The normalized expression data of individual genes in the two pro-B cell types were plotted as RPM (reads per gene per million mapped sequence tags) values. Each dot represents one gene. Activated and repressed Ikaros target genes, which were identified as described in (f), are colored in blue or red, respectively. (h) Scatter plot of gene expression changes determined in ex vivo sorted Ikzf1Δ/– and Ikzf1Δ/+ pro-B cells. Genes in the ex vivo RNA-seq data, which correspond to the activated and repressed Ikaros target genes identified in in vitro cultured pro-B cells (f), are colored in blue and red, respectively.

