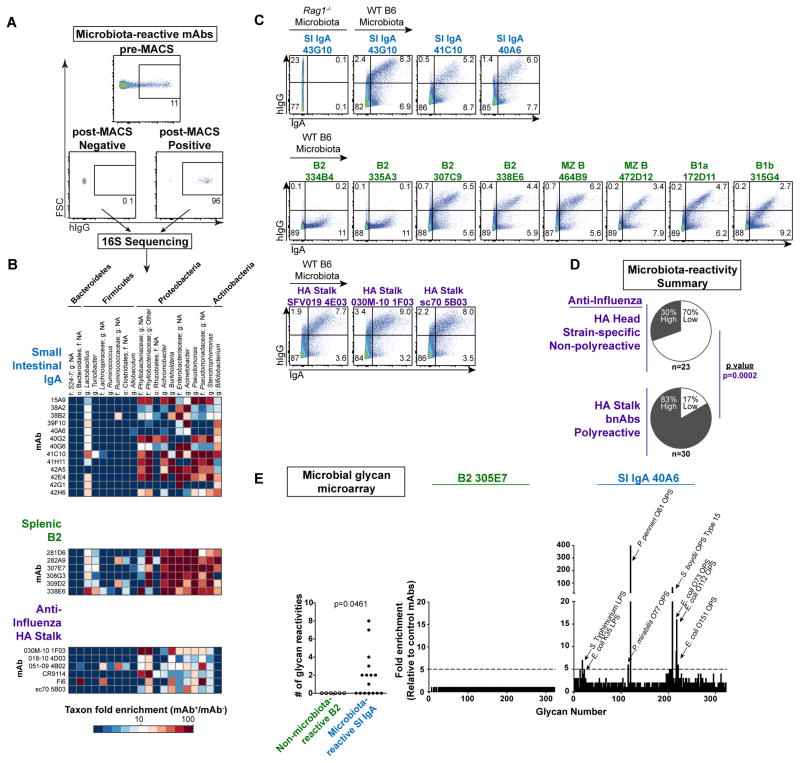
Figure 2. Microbiota-reactive antibodies bind a broad but defined subset of commensal bacteria.
(A) Representative plots depicting pre-MACS and post-MACS positive or negative fractions used for 16S sequencing analysis of mAb-bound or –unbound bacteria purified from Rag1−/− SI microbiota. (B) Microbial taxa bound by individual mAbs from indicated panels; enrichment in 16S sequencing data calculated by relative abundance in mAb+/mAb− fractions. All mAbs in a given panel were co-purified in the same experiment. Data compiled from three independent experiments. Taxonomy abbreviations: o= order; f=family; g=genus. (C) Flow cytometry of Rag1−/− or WT B6 colonic microbiota comparing bacteria stained by indicated mAbs with those endogenously coated by polyclonal IgA. Data compiled from three independent experiments. (D) Summary of microbiota-reactivity for panels of non-polyreactive strain-specific mAbs against the HA head or polyreactive bnAbs against the HA stalk. Numbers of mAbs analyzed in each panel are indicated below each chart. P value calculated by Fisher’s exact test. (E) Summary of microbial glycan microarray reactivities for microbiota-reactive IgA mAbs or non-microbiota-reactive B2 mAbs (left), and representative reactivities of individual mAbs (right). P value calculated by Fisher’s exact test. Data expressed as enrichment over average background of six B2 negative control mAbs. Annotated peaks showed >5-fold enrichment. Data compiled from two independent experiments.

