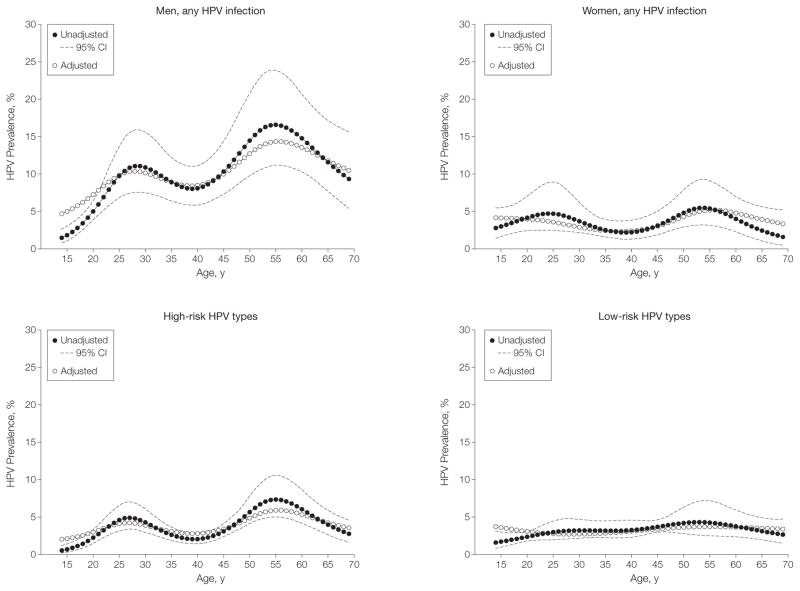
Figure 3. Modeled HPV Prevalence Across Age in the US Population Aged 14 to 69 Years by Sex and HPV Types.
Age was modeled using restricted cubic splines with 5 knots (age and 3 spline terms). To evaluate the influence of covariates on human papillomavirus (HPV) prevalence across age, models were adjusted for sex, race, smoking, marital status, and lifetime number of (any) sex partners, as appropriate. Given the standardization for covariates included in the multivariate models, the HPV prevalence curves obtained from the adjusted models are presented at the mean levels of the covariates (sex, race, smoking, marital status, and lifetime number of any sex partners, as appropriate) and aligned with the HPV prevalence curve in the unadjusted models to enable visual display of the data. For men, unadjusted P<.001; adjusted P=.002. For women, unadjusted P=.07; adjusted P=.14. For high-risk HPV, unadjusted P<.001; adjusted P<.001. For low-risk HPV, unadjusted P=.10; adjusted P=.64. P values less than .05 for spline terms denote statistical evidence for bimodality in the data.

