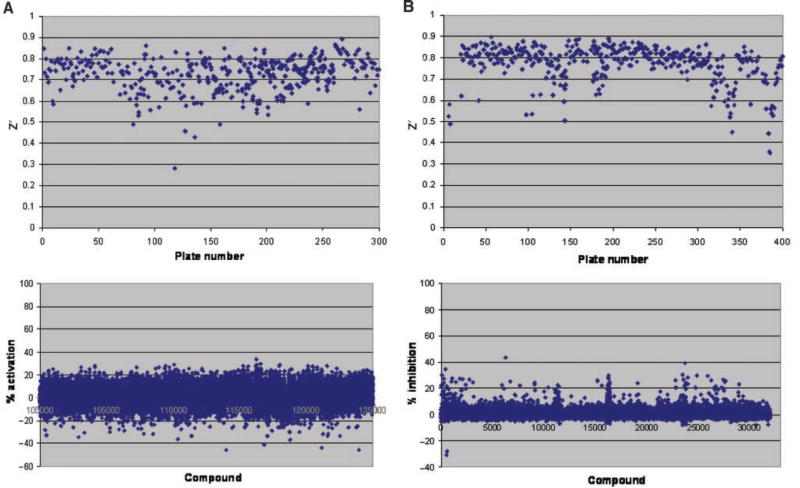
Fig. 3.
Scatter plots showing Z prime (Z′) factor per plate and compound IP-One assay readings from high-throughput screens. (A) Z′ factor plot for plates (upper panel) and IP1 activation by compounds at a 1-µM concentration (lower panel) in screen for GPR54 agonists. (B) Z′ factor plot for plates (upper panel) and inhibition of IP1 accumulation by 0.2 µM hkiss-10 by compounds at 10 µM concentration (lower panel) in screen for GPR54 antagonists.

